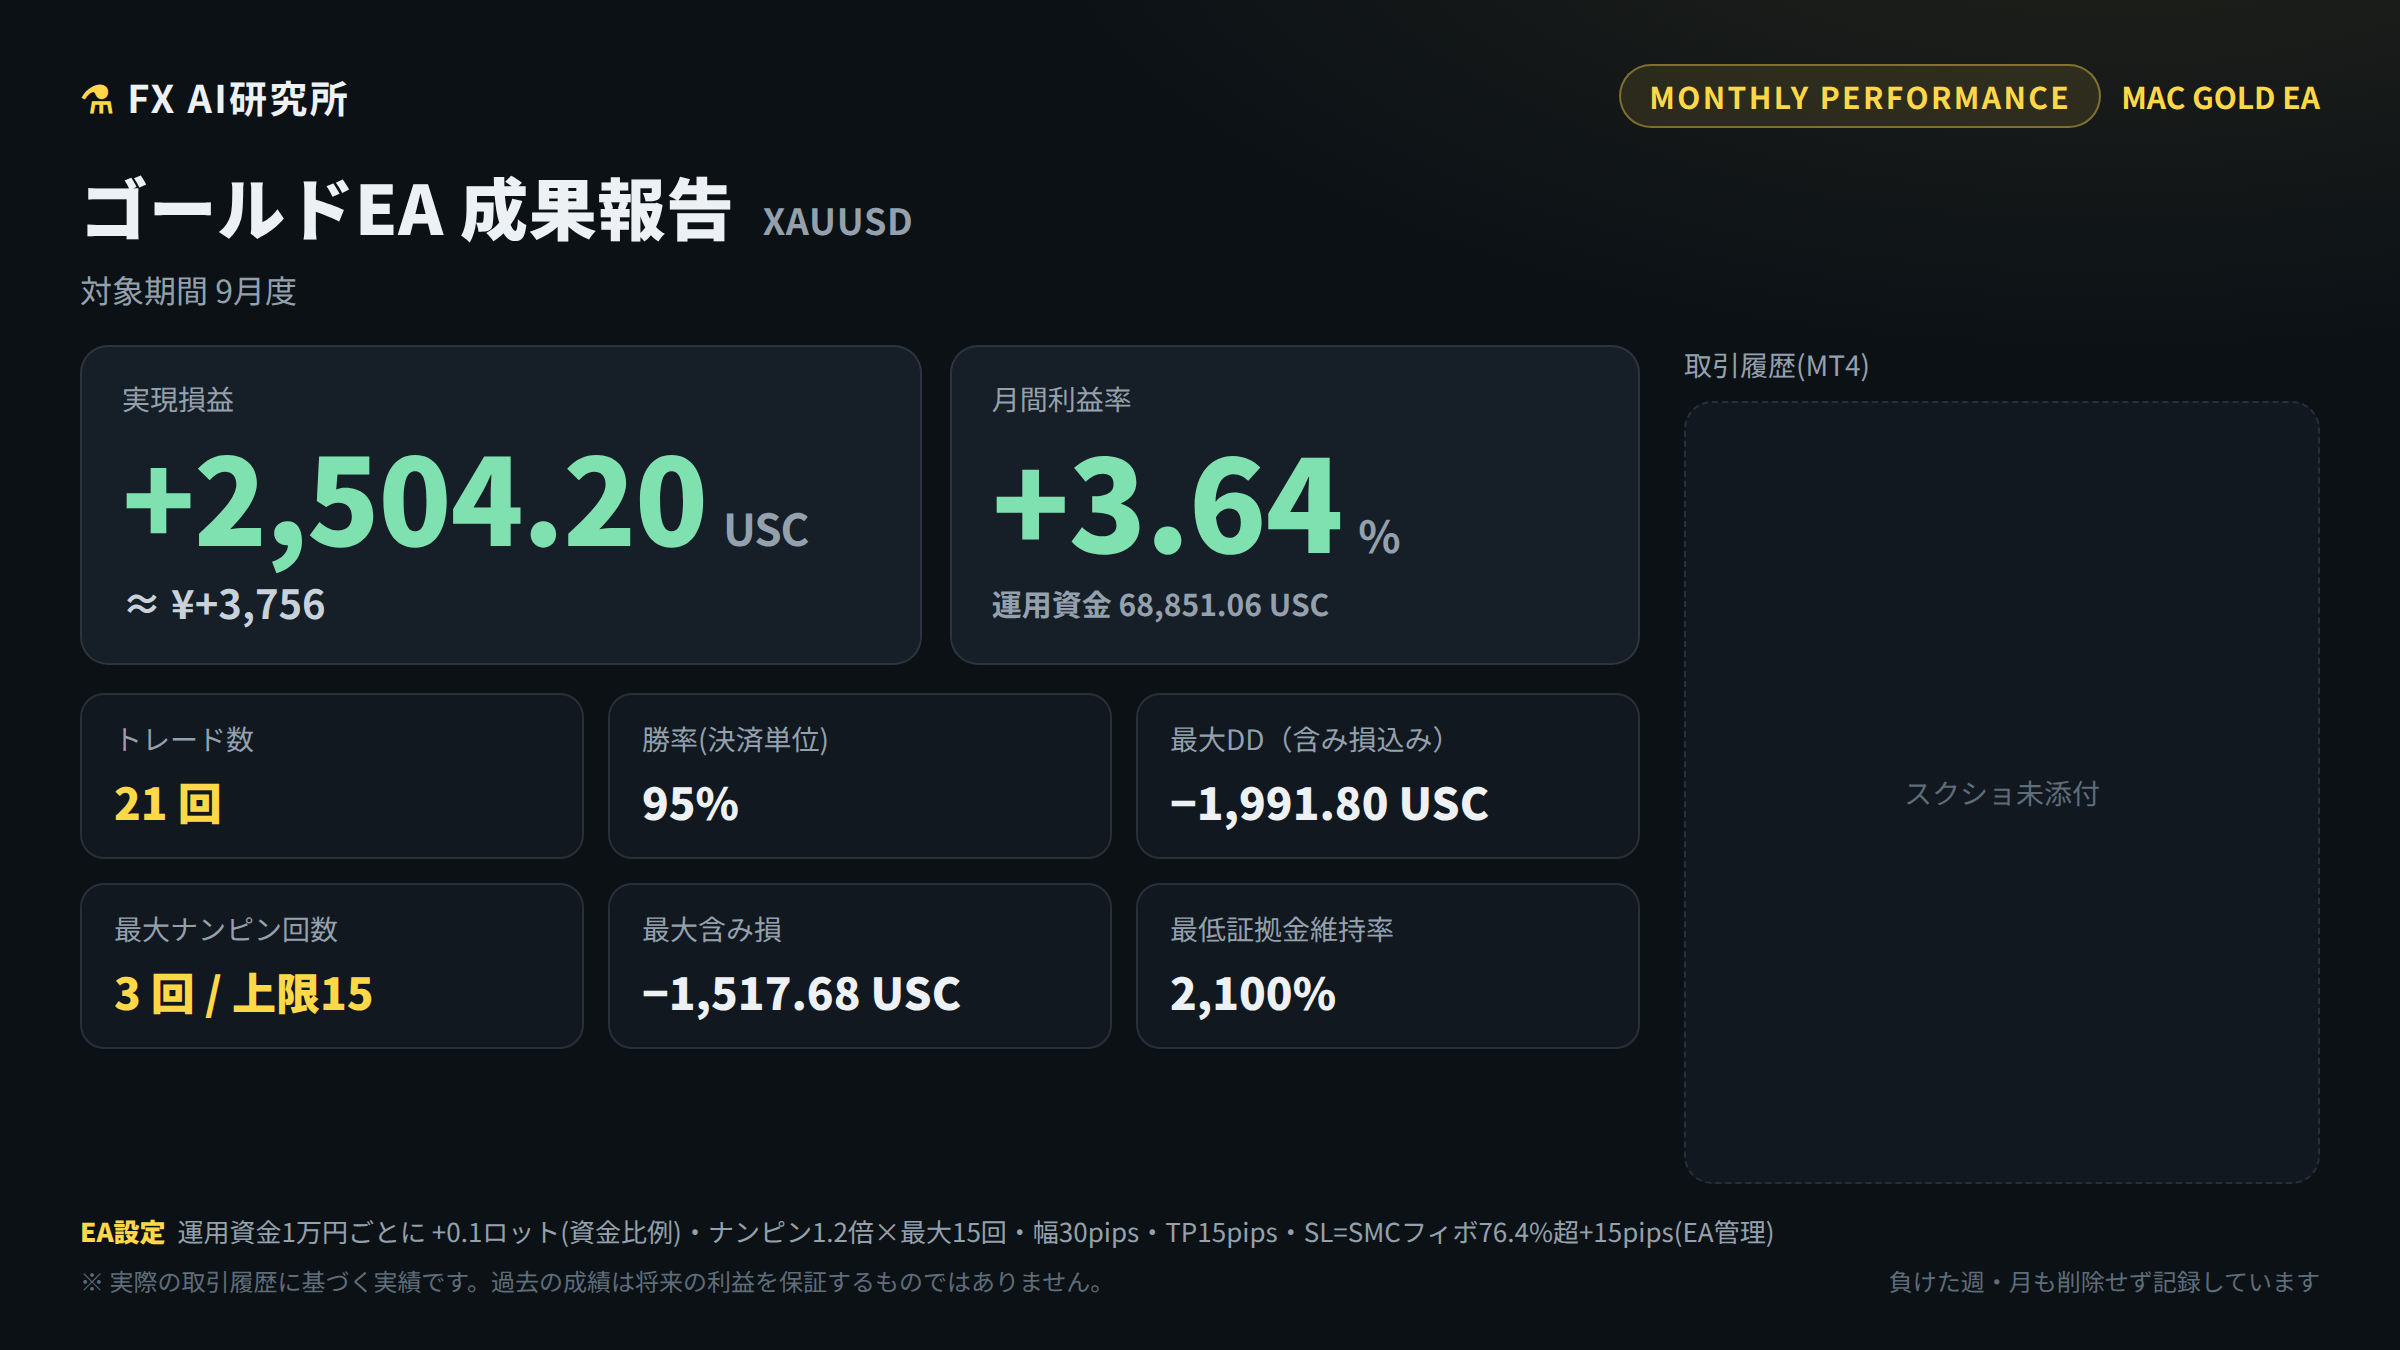
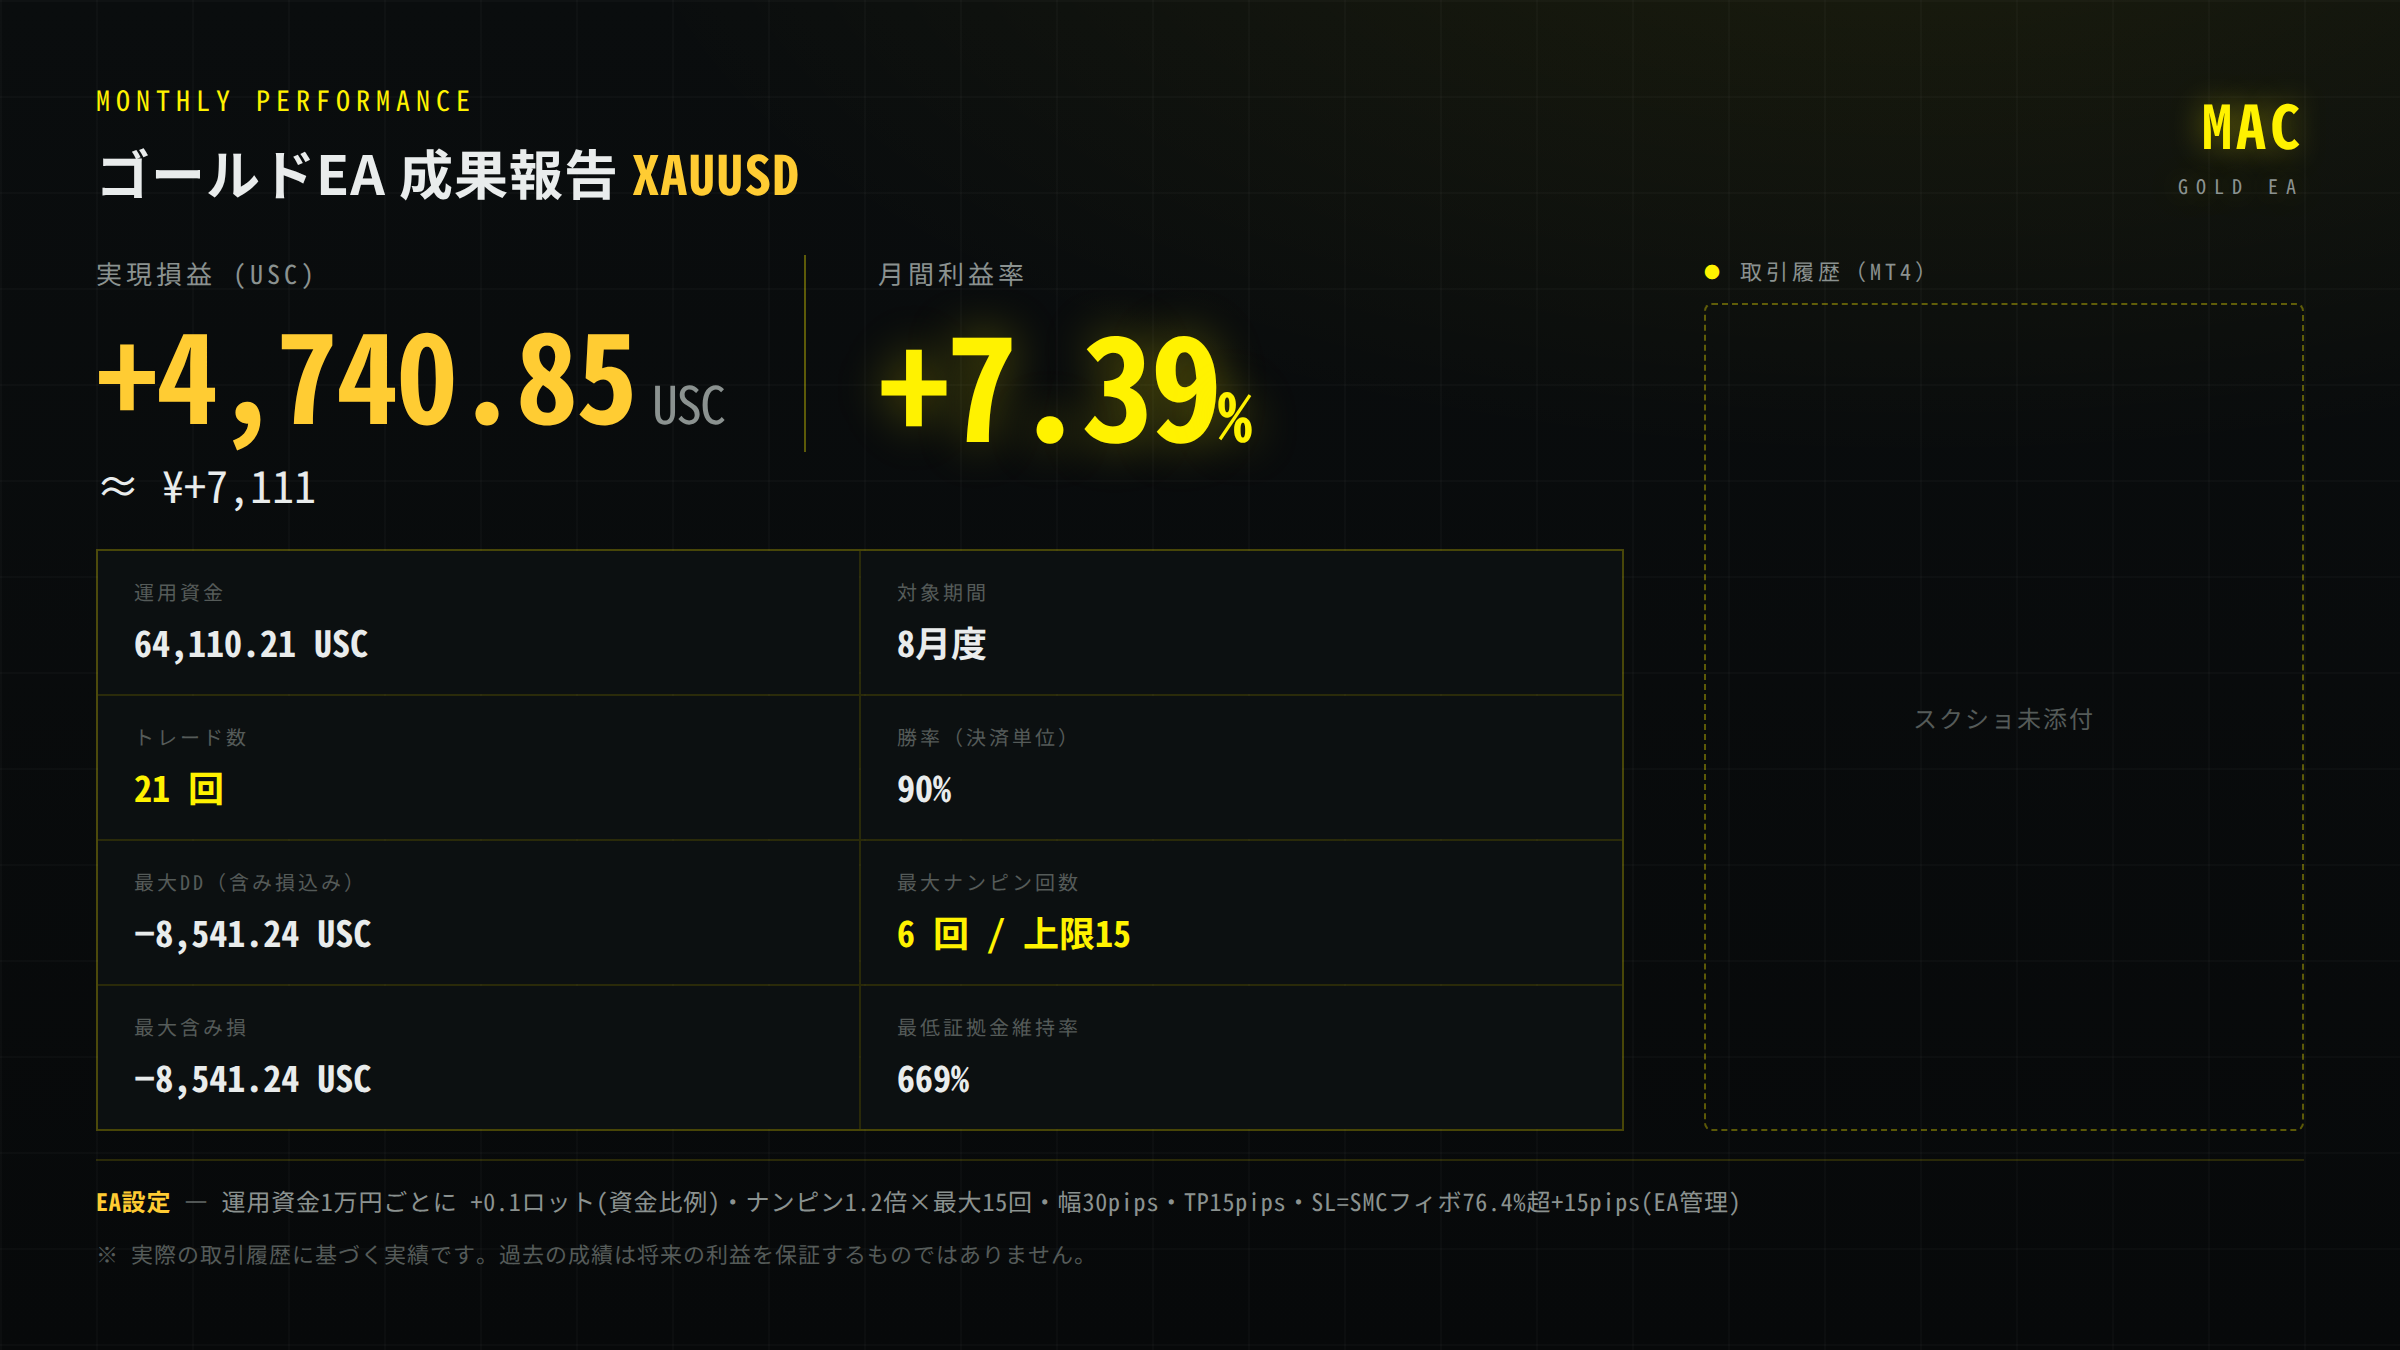
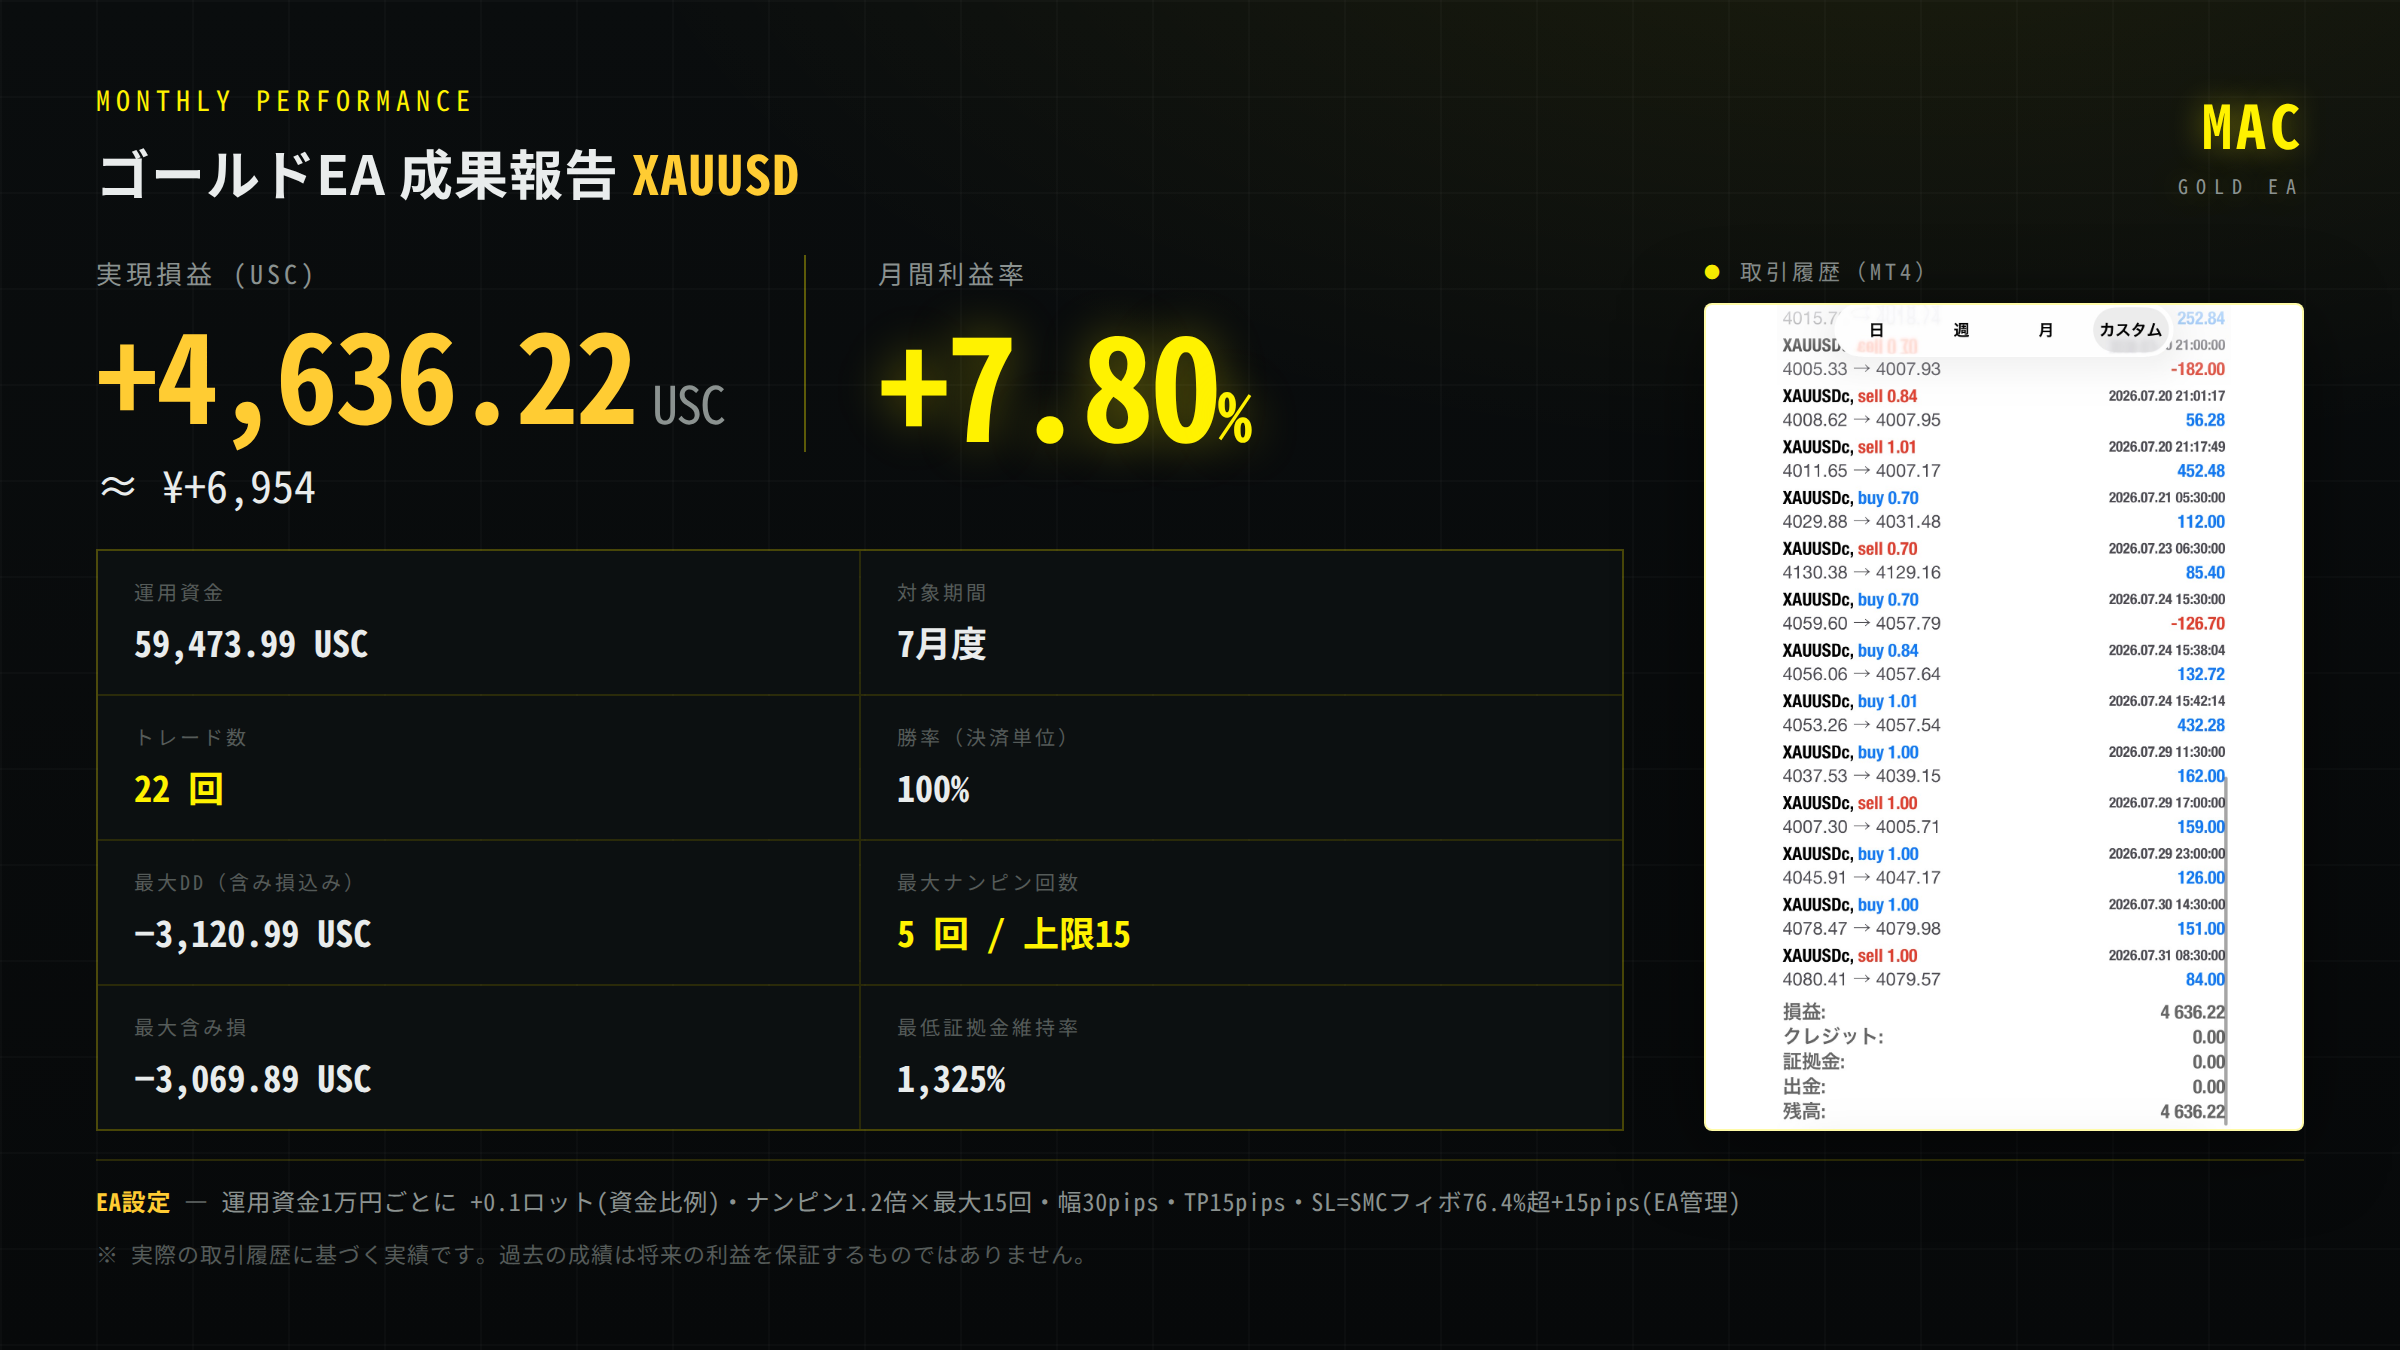
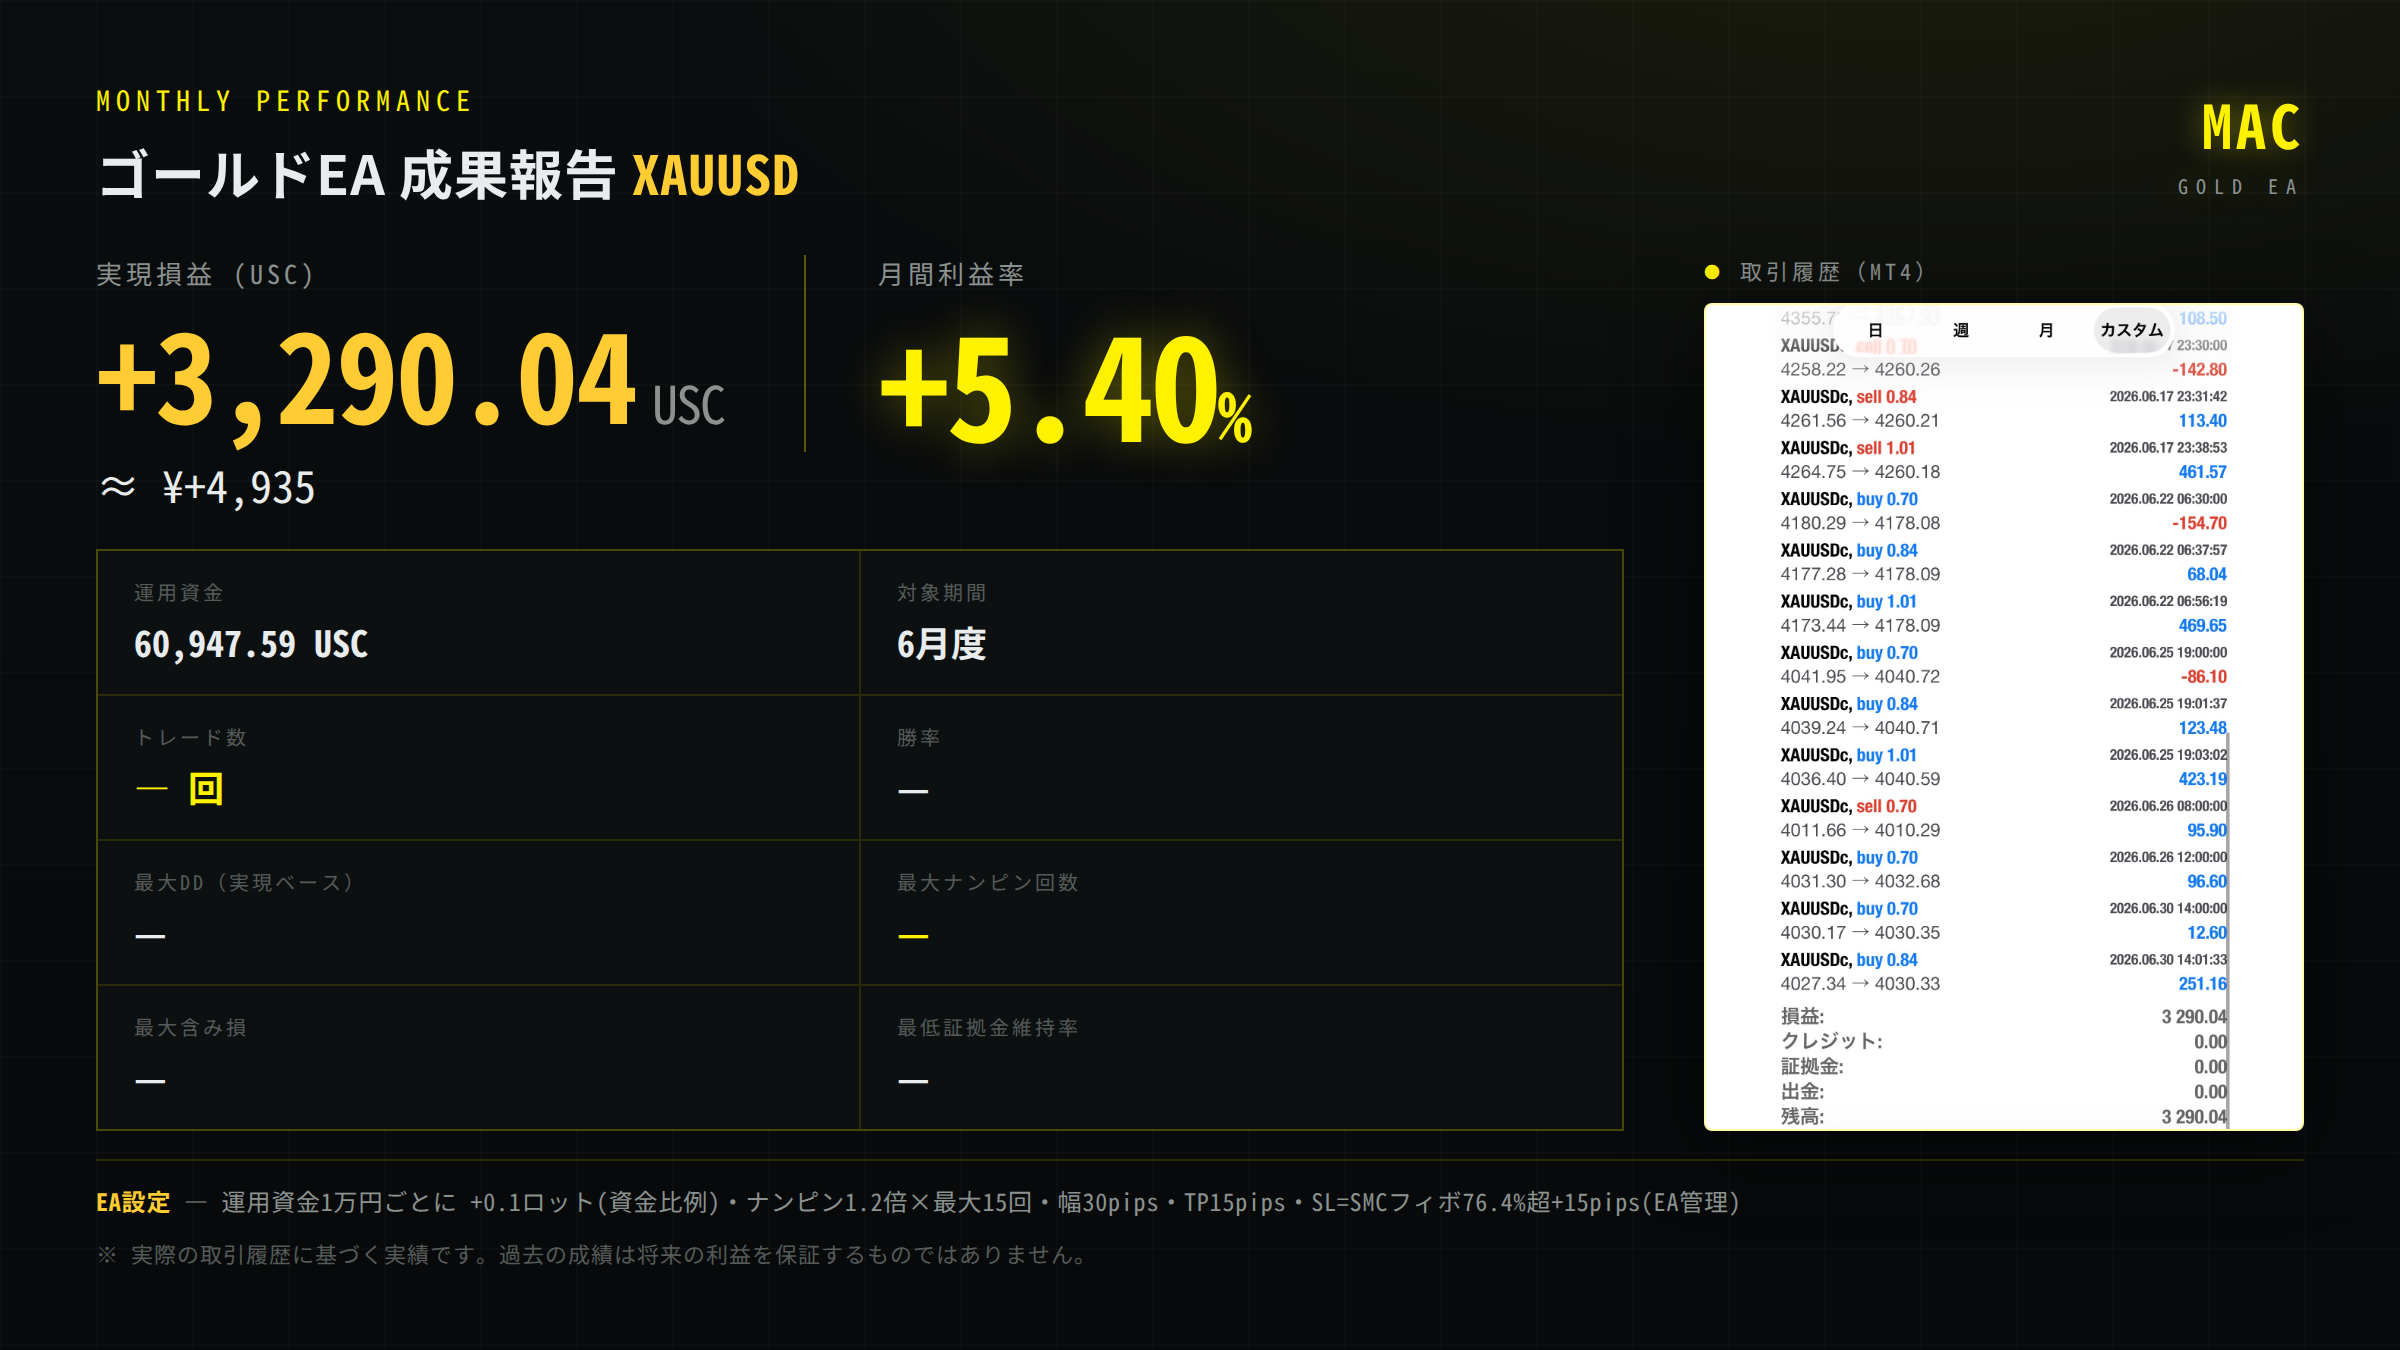
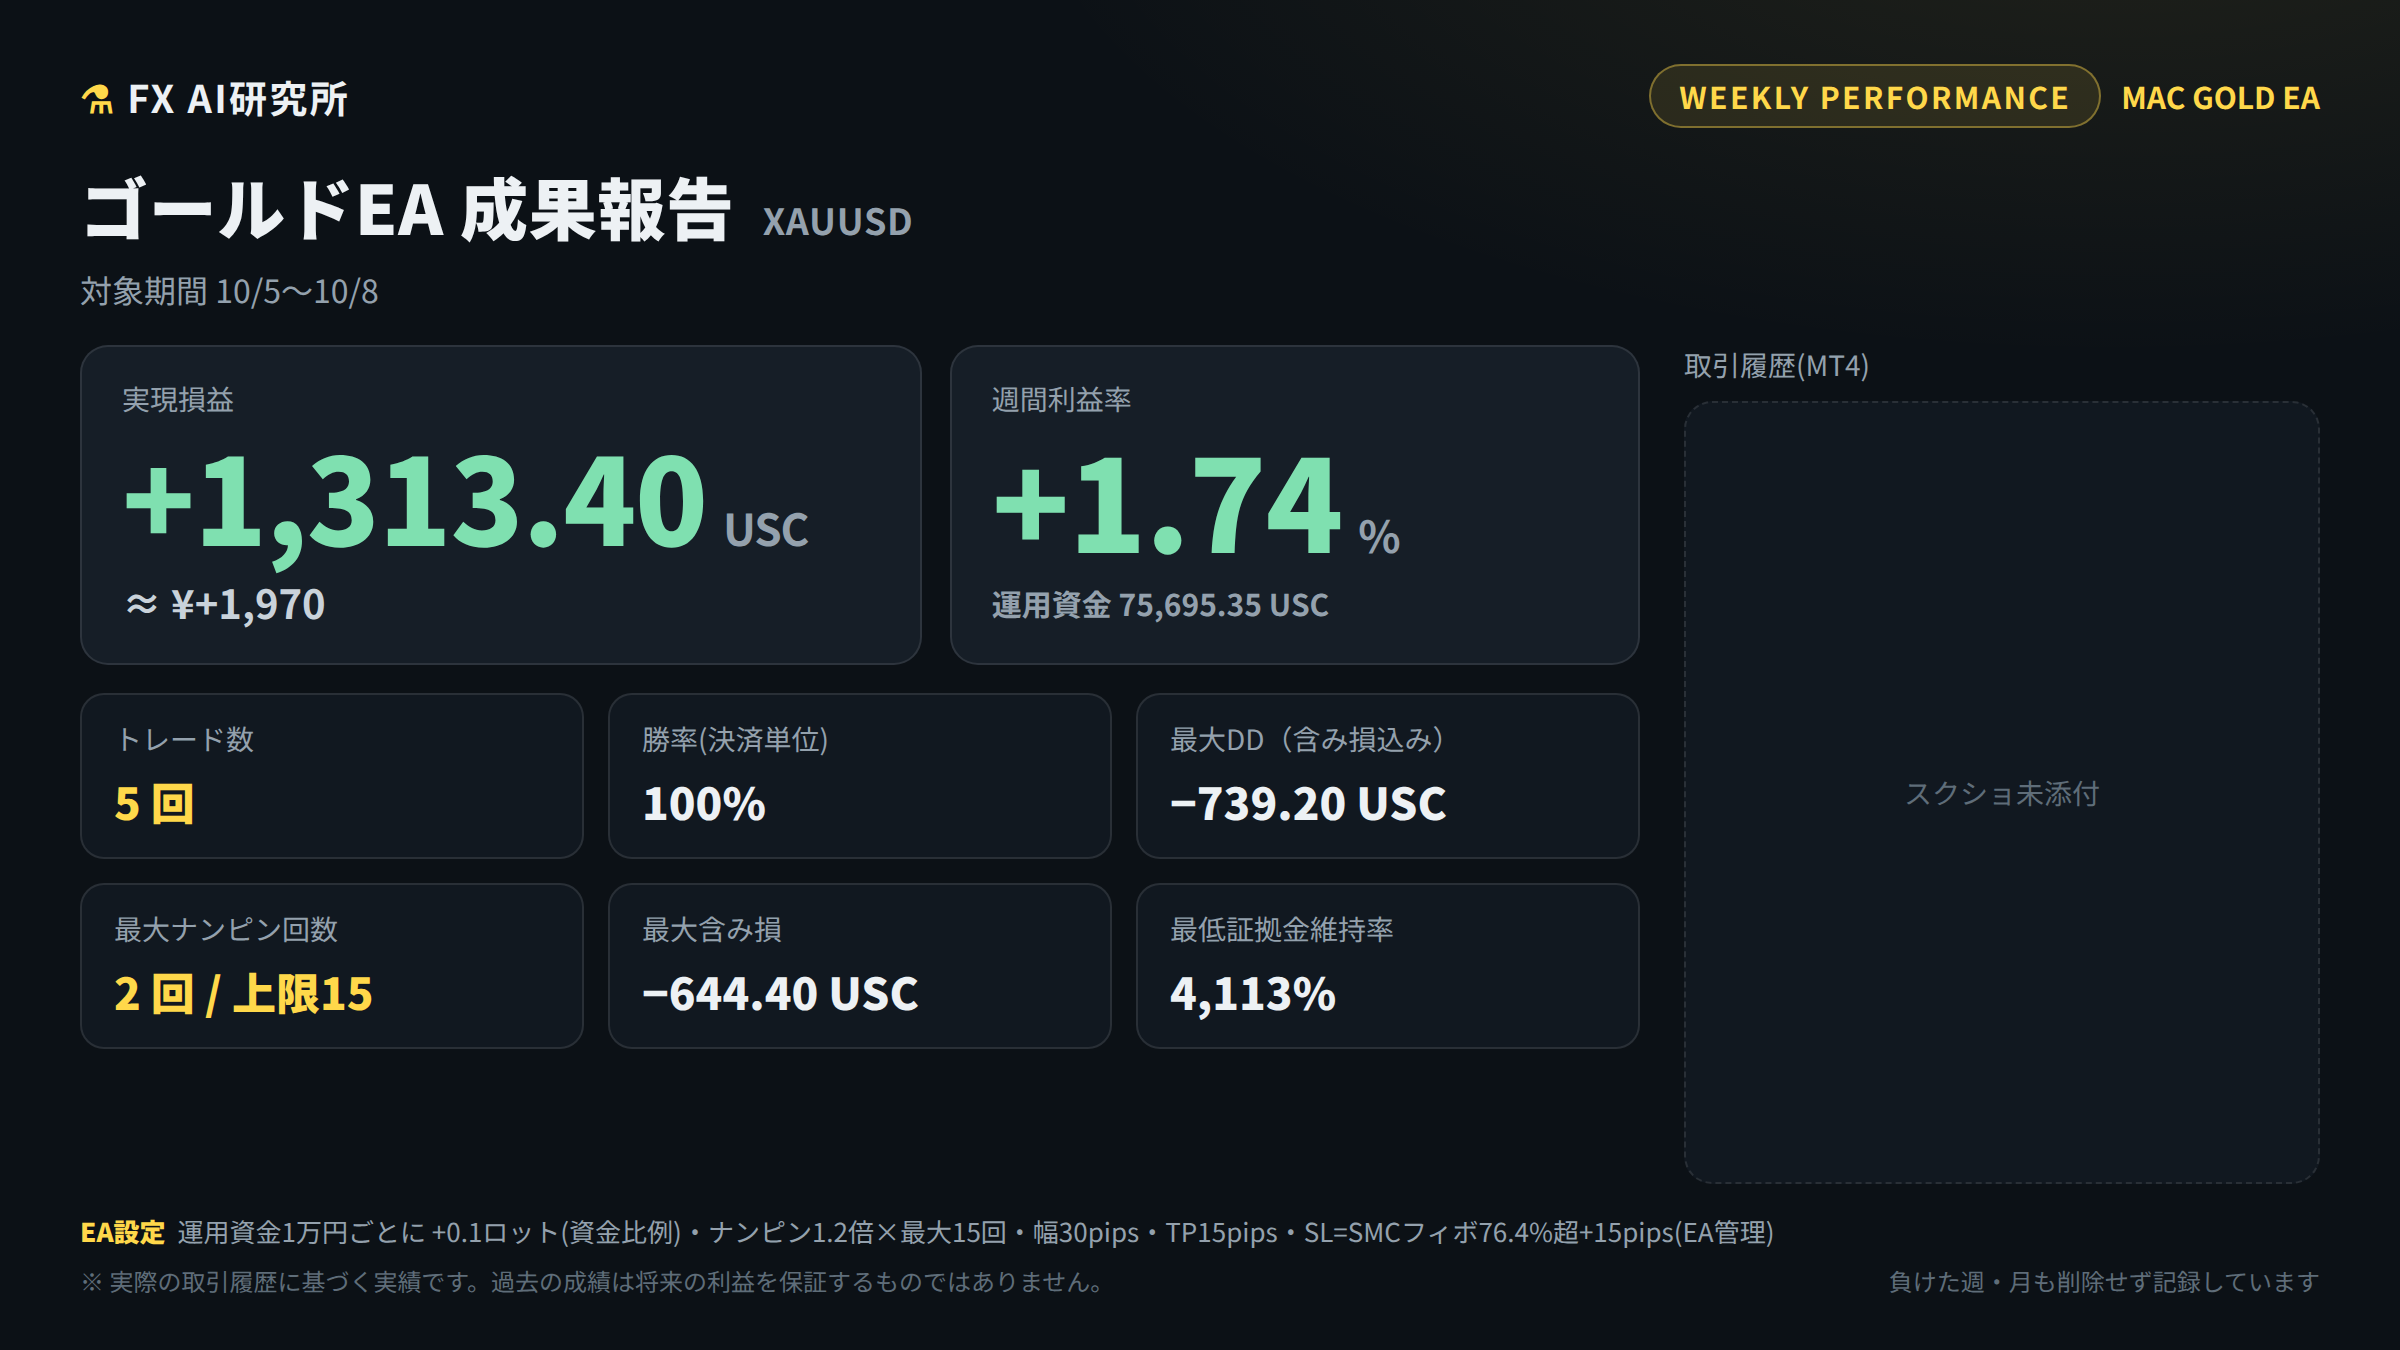
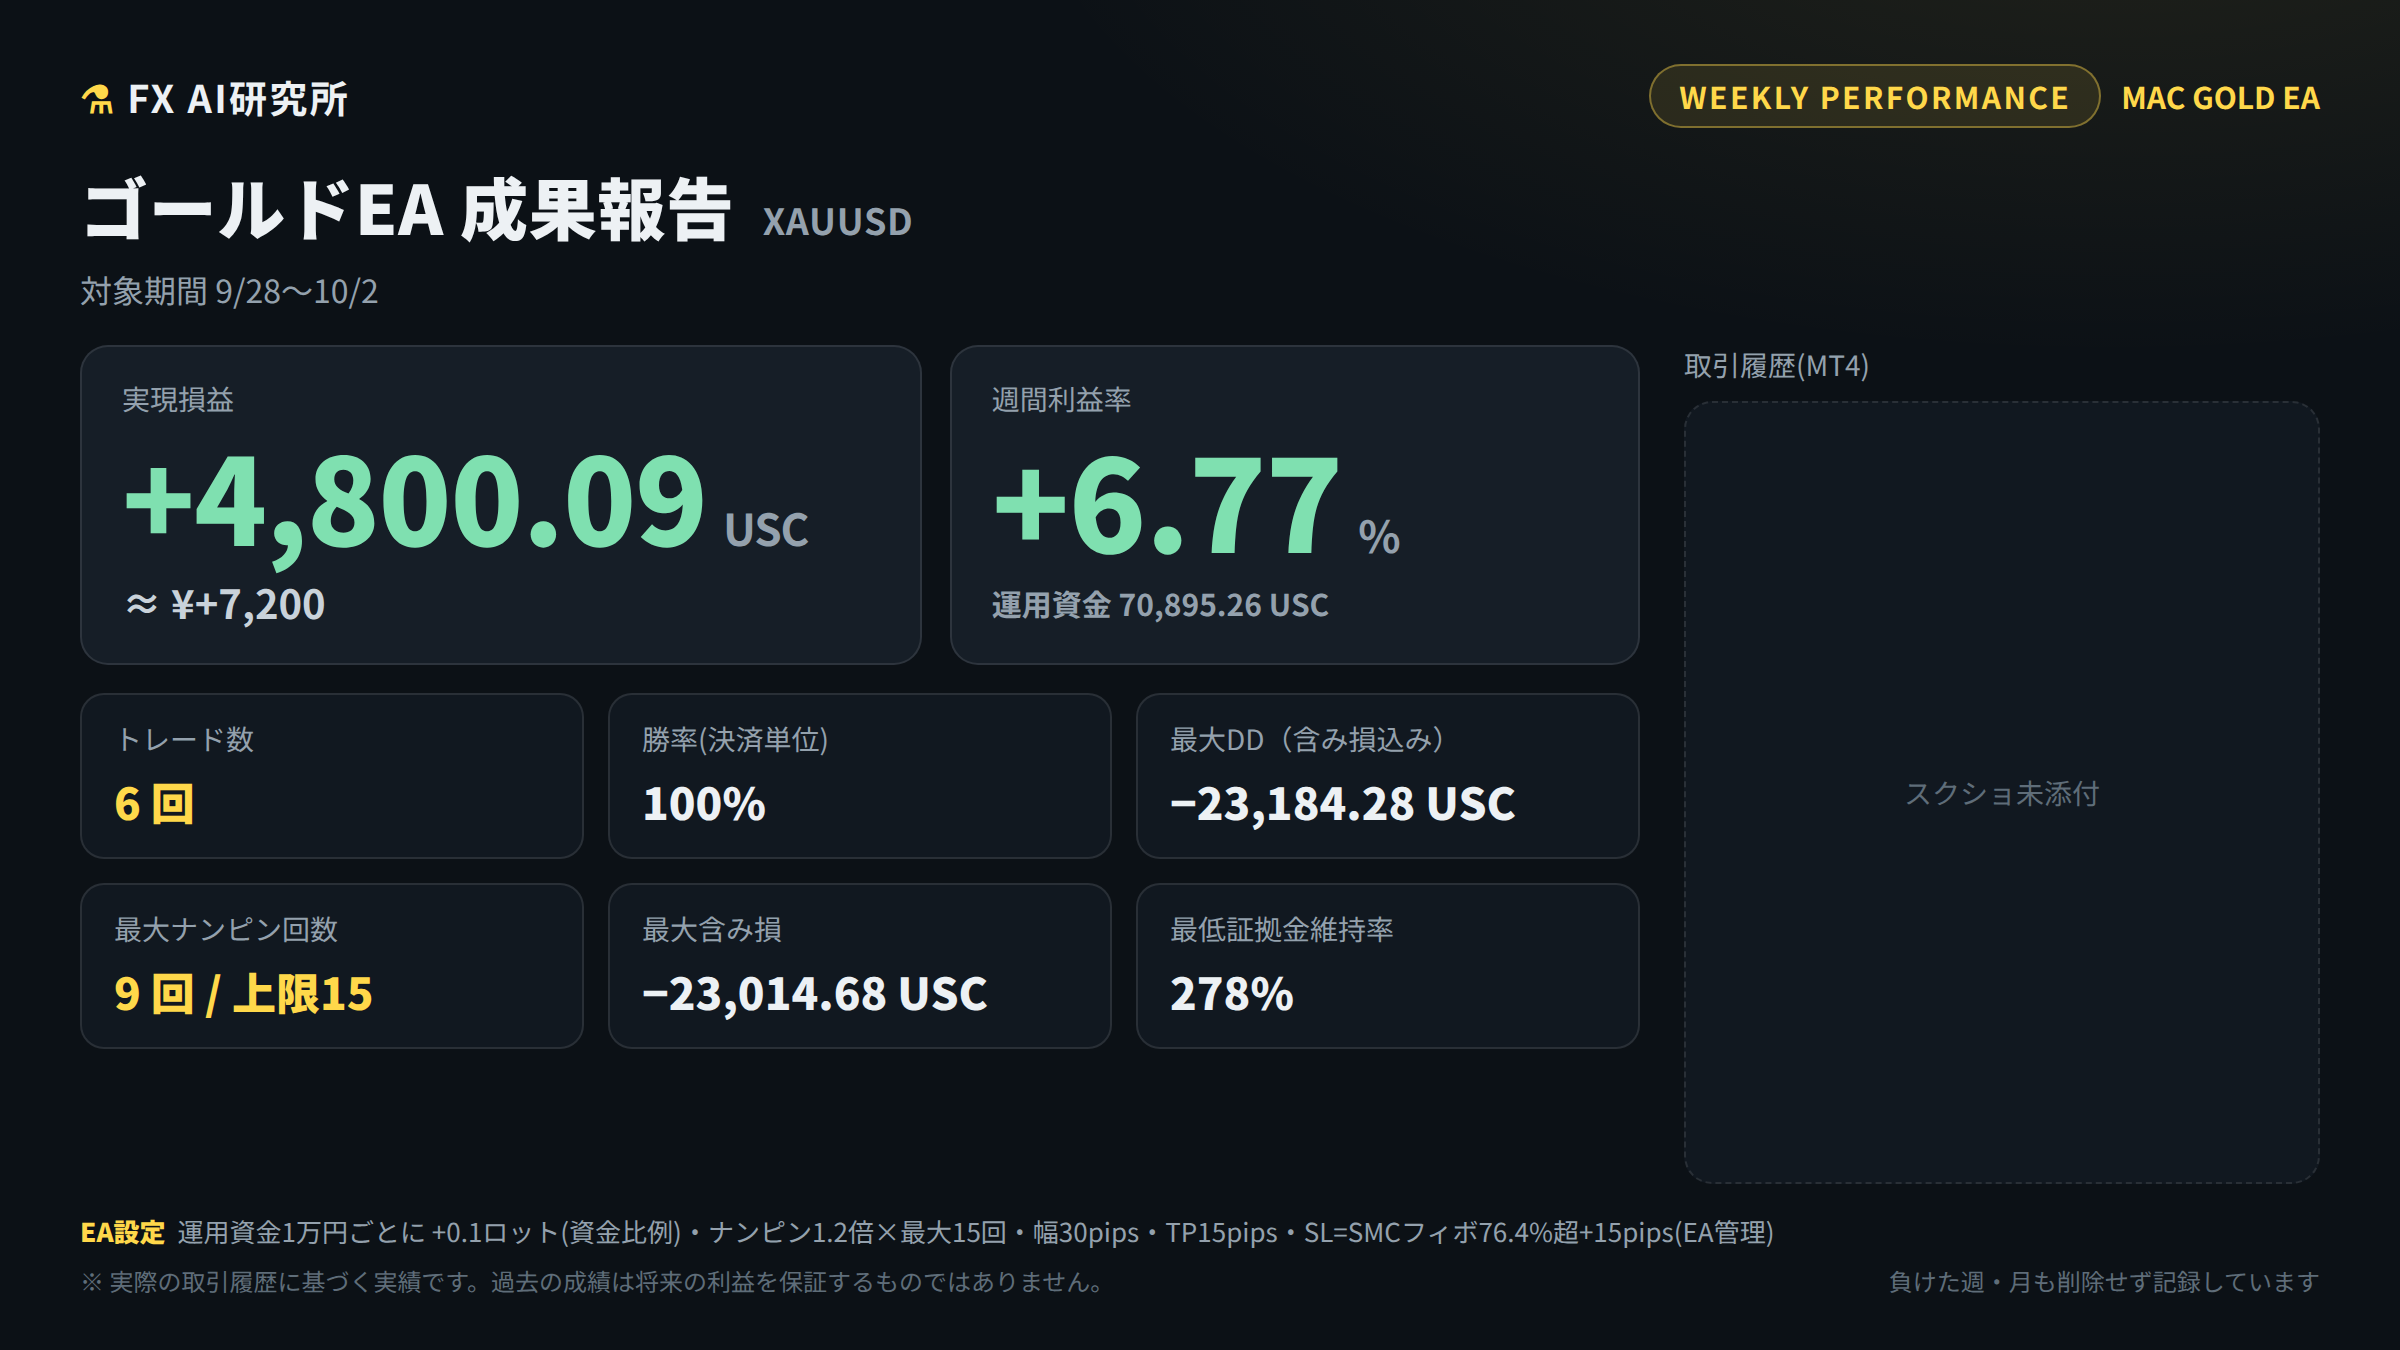
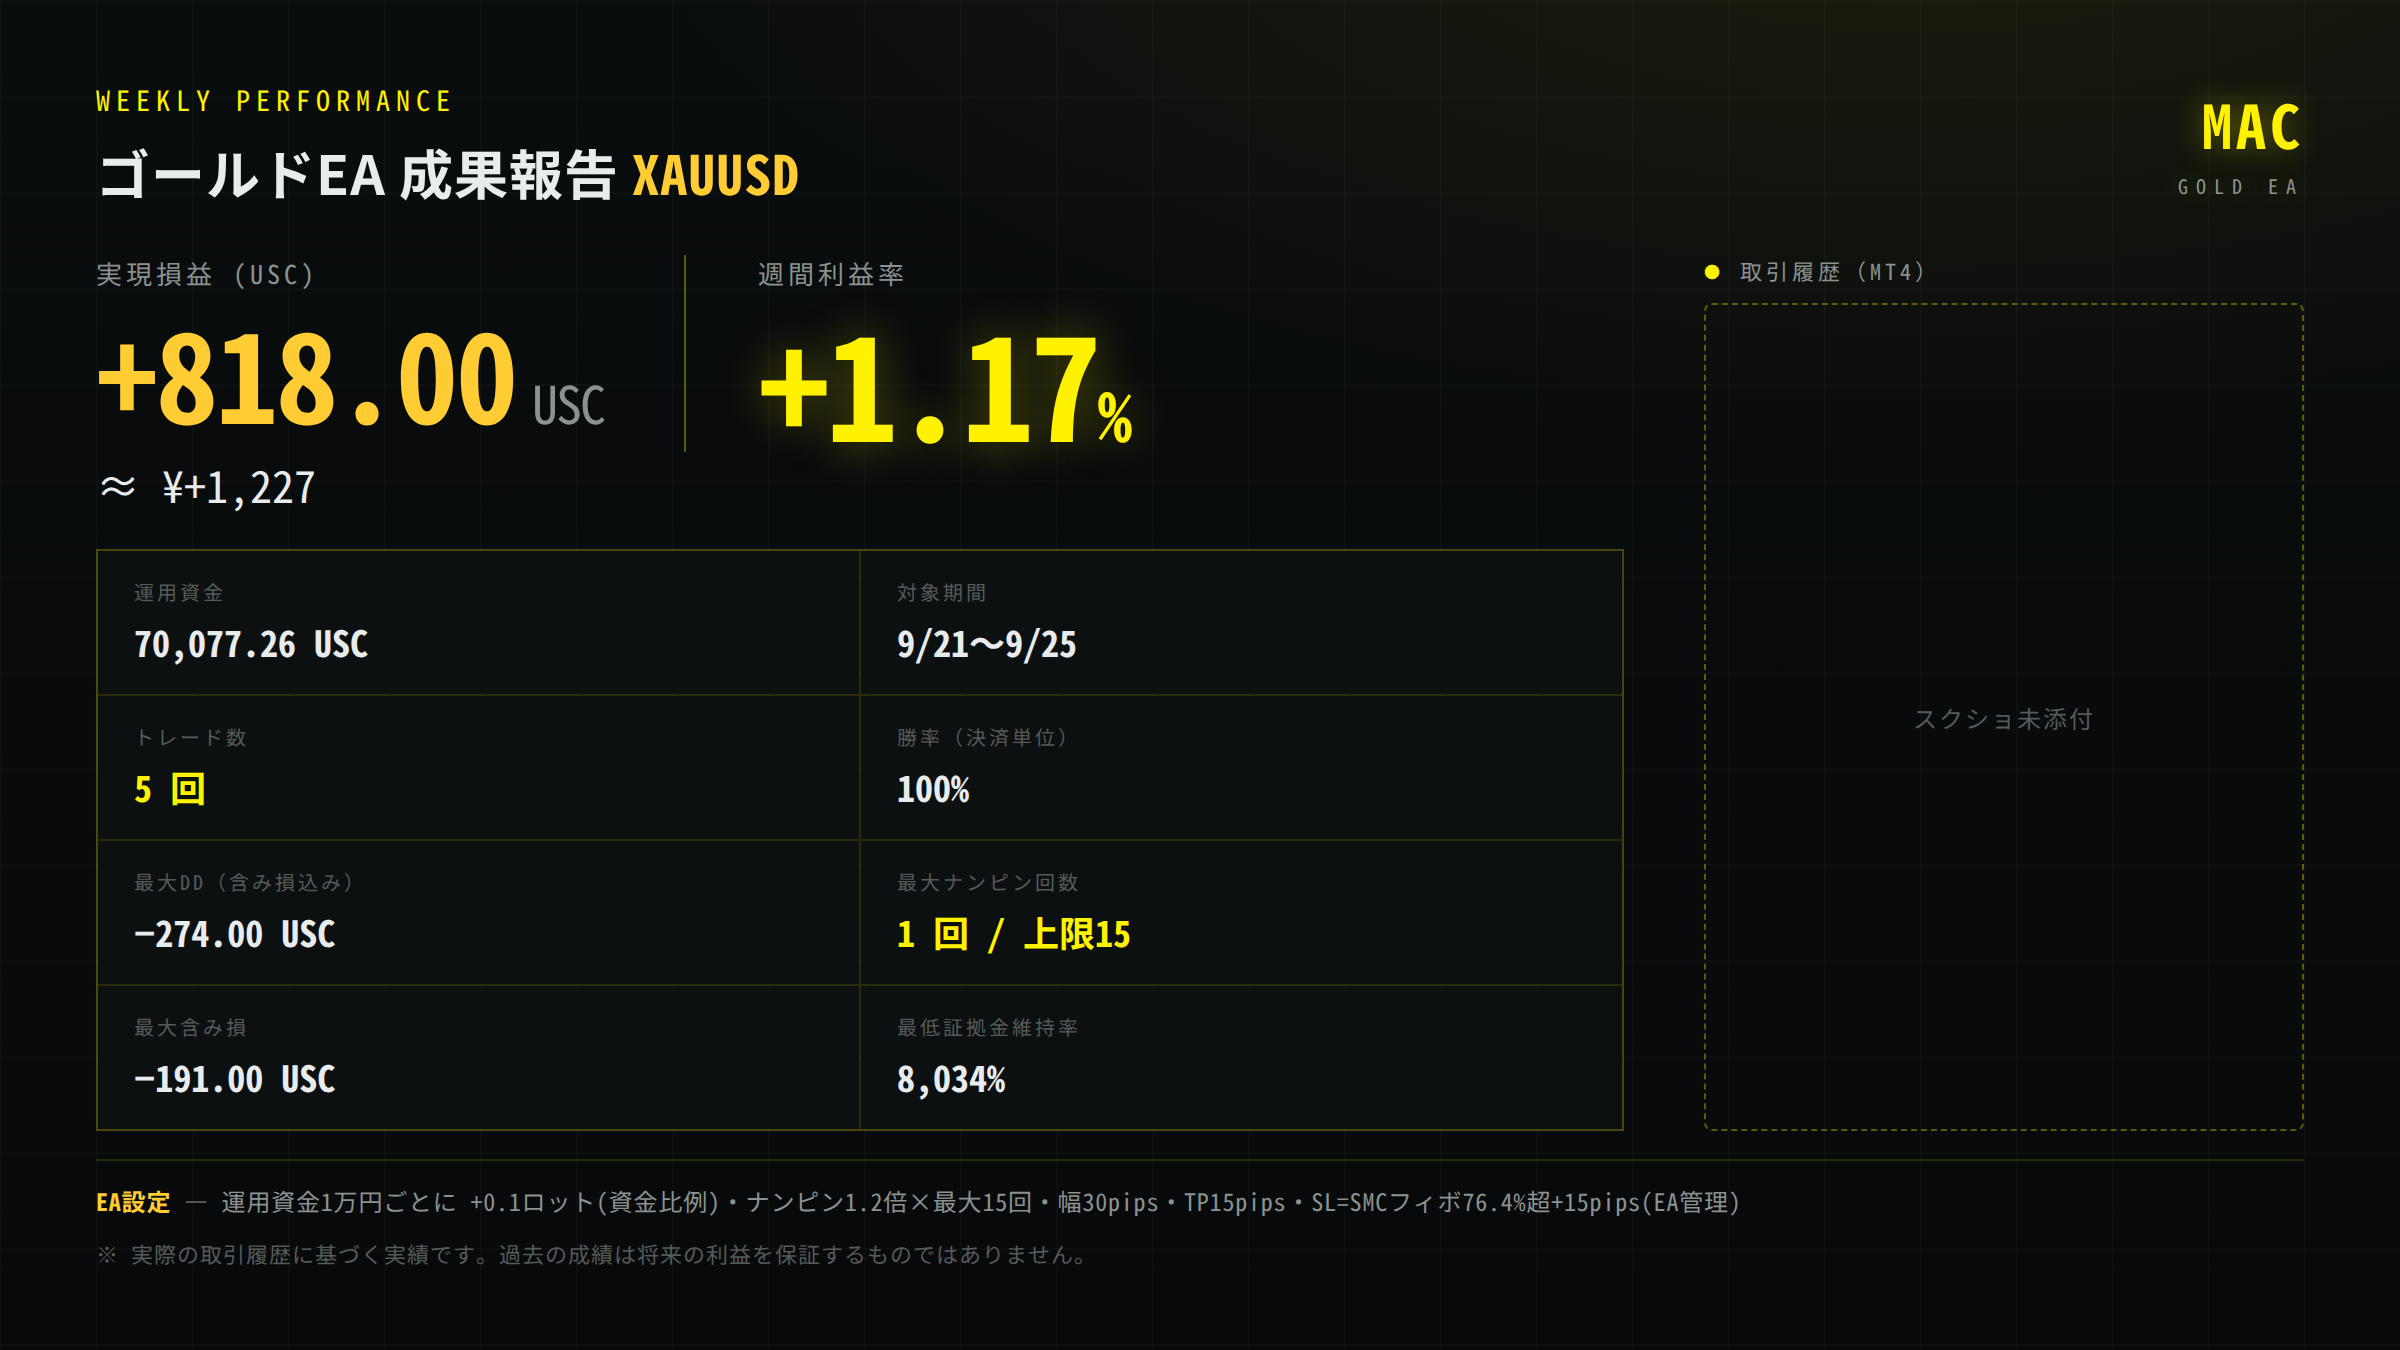
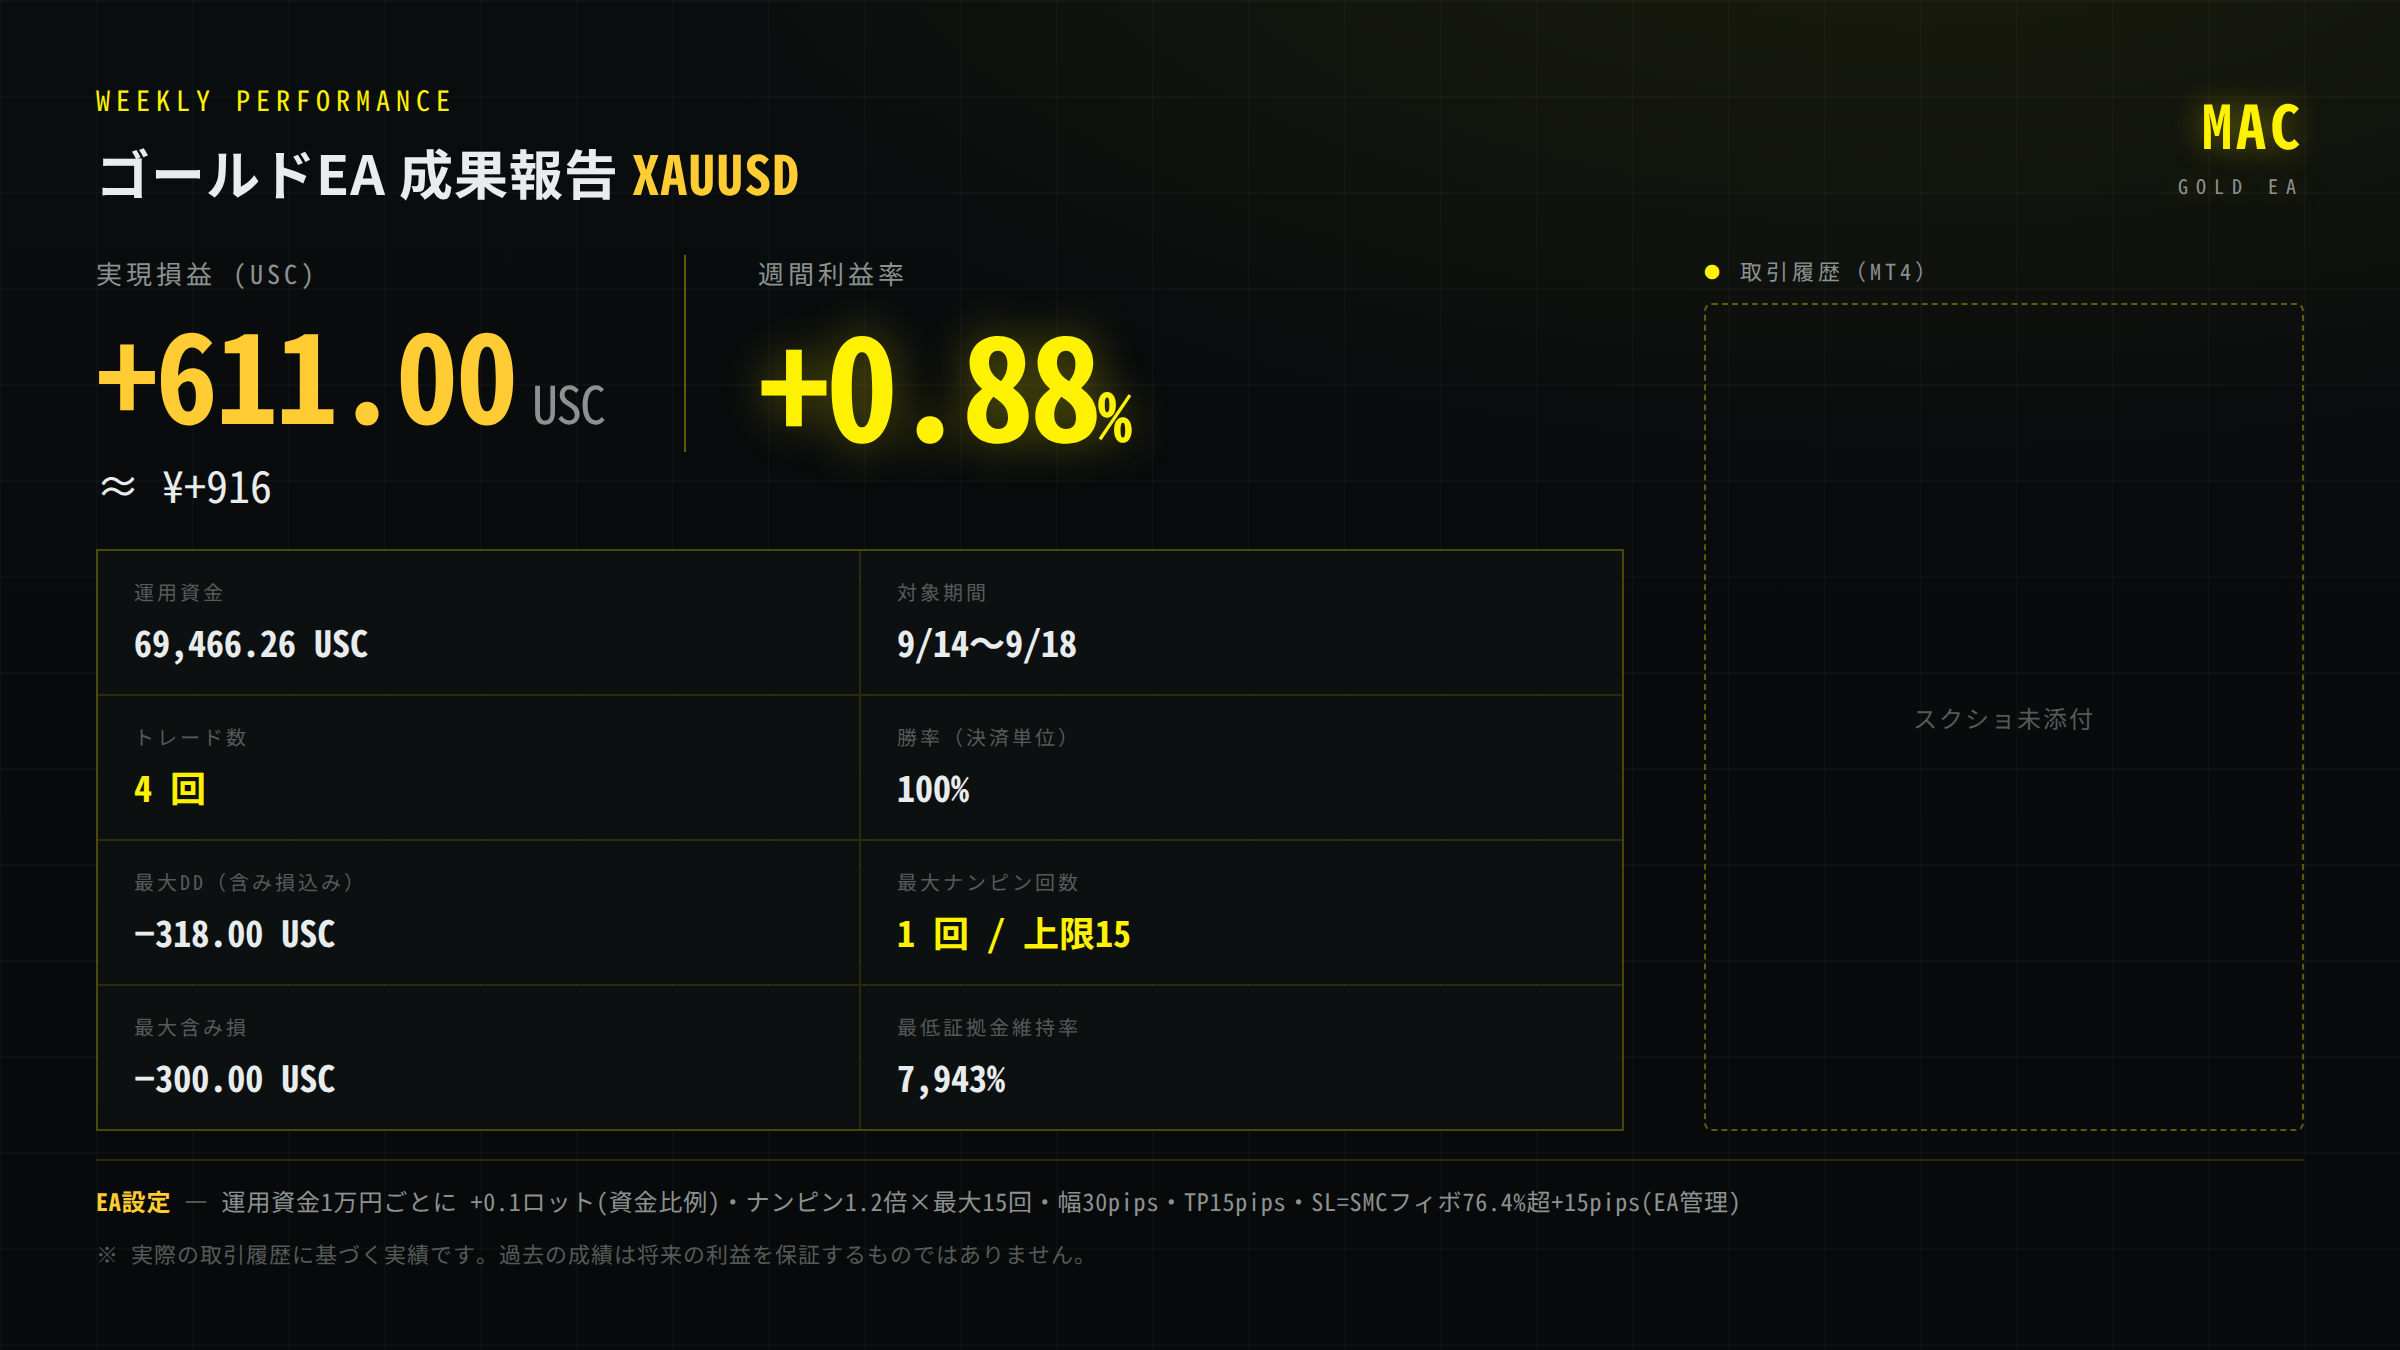
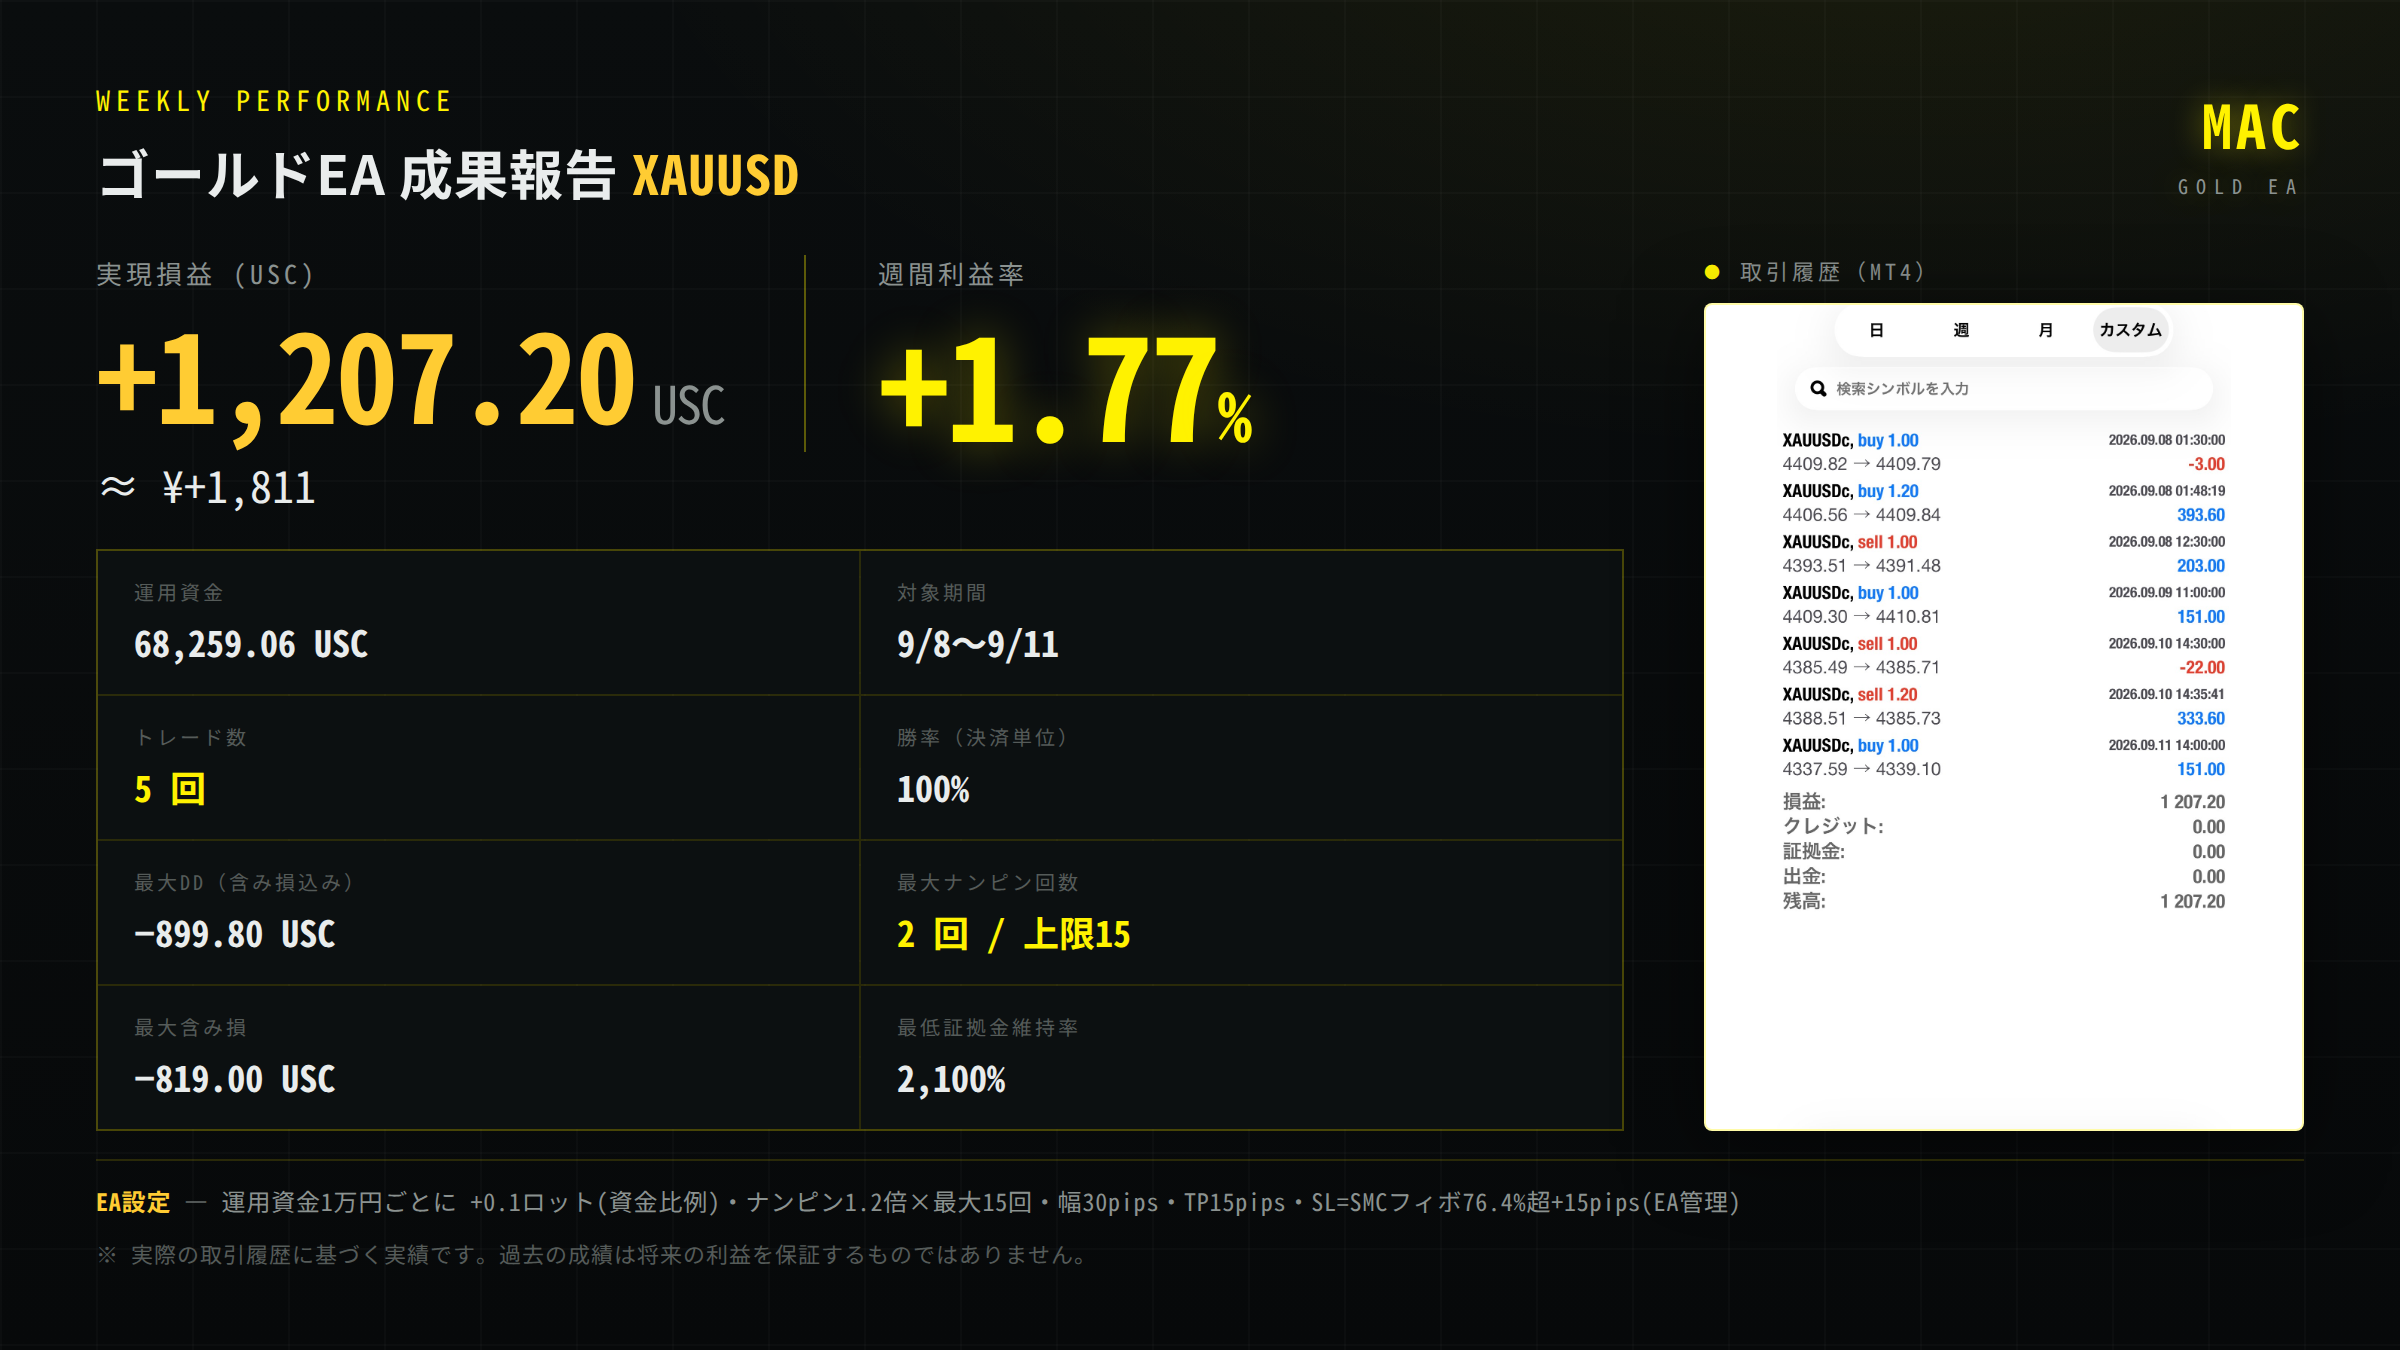
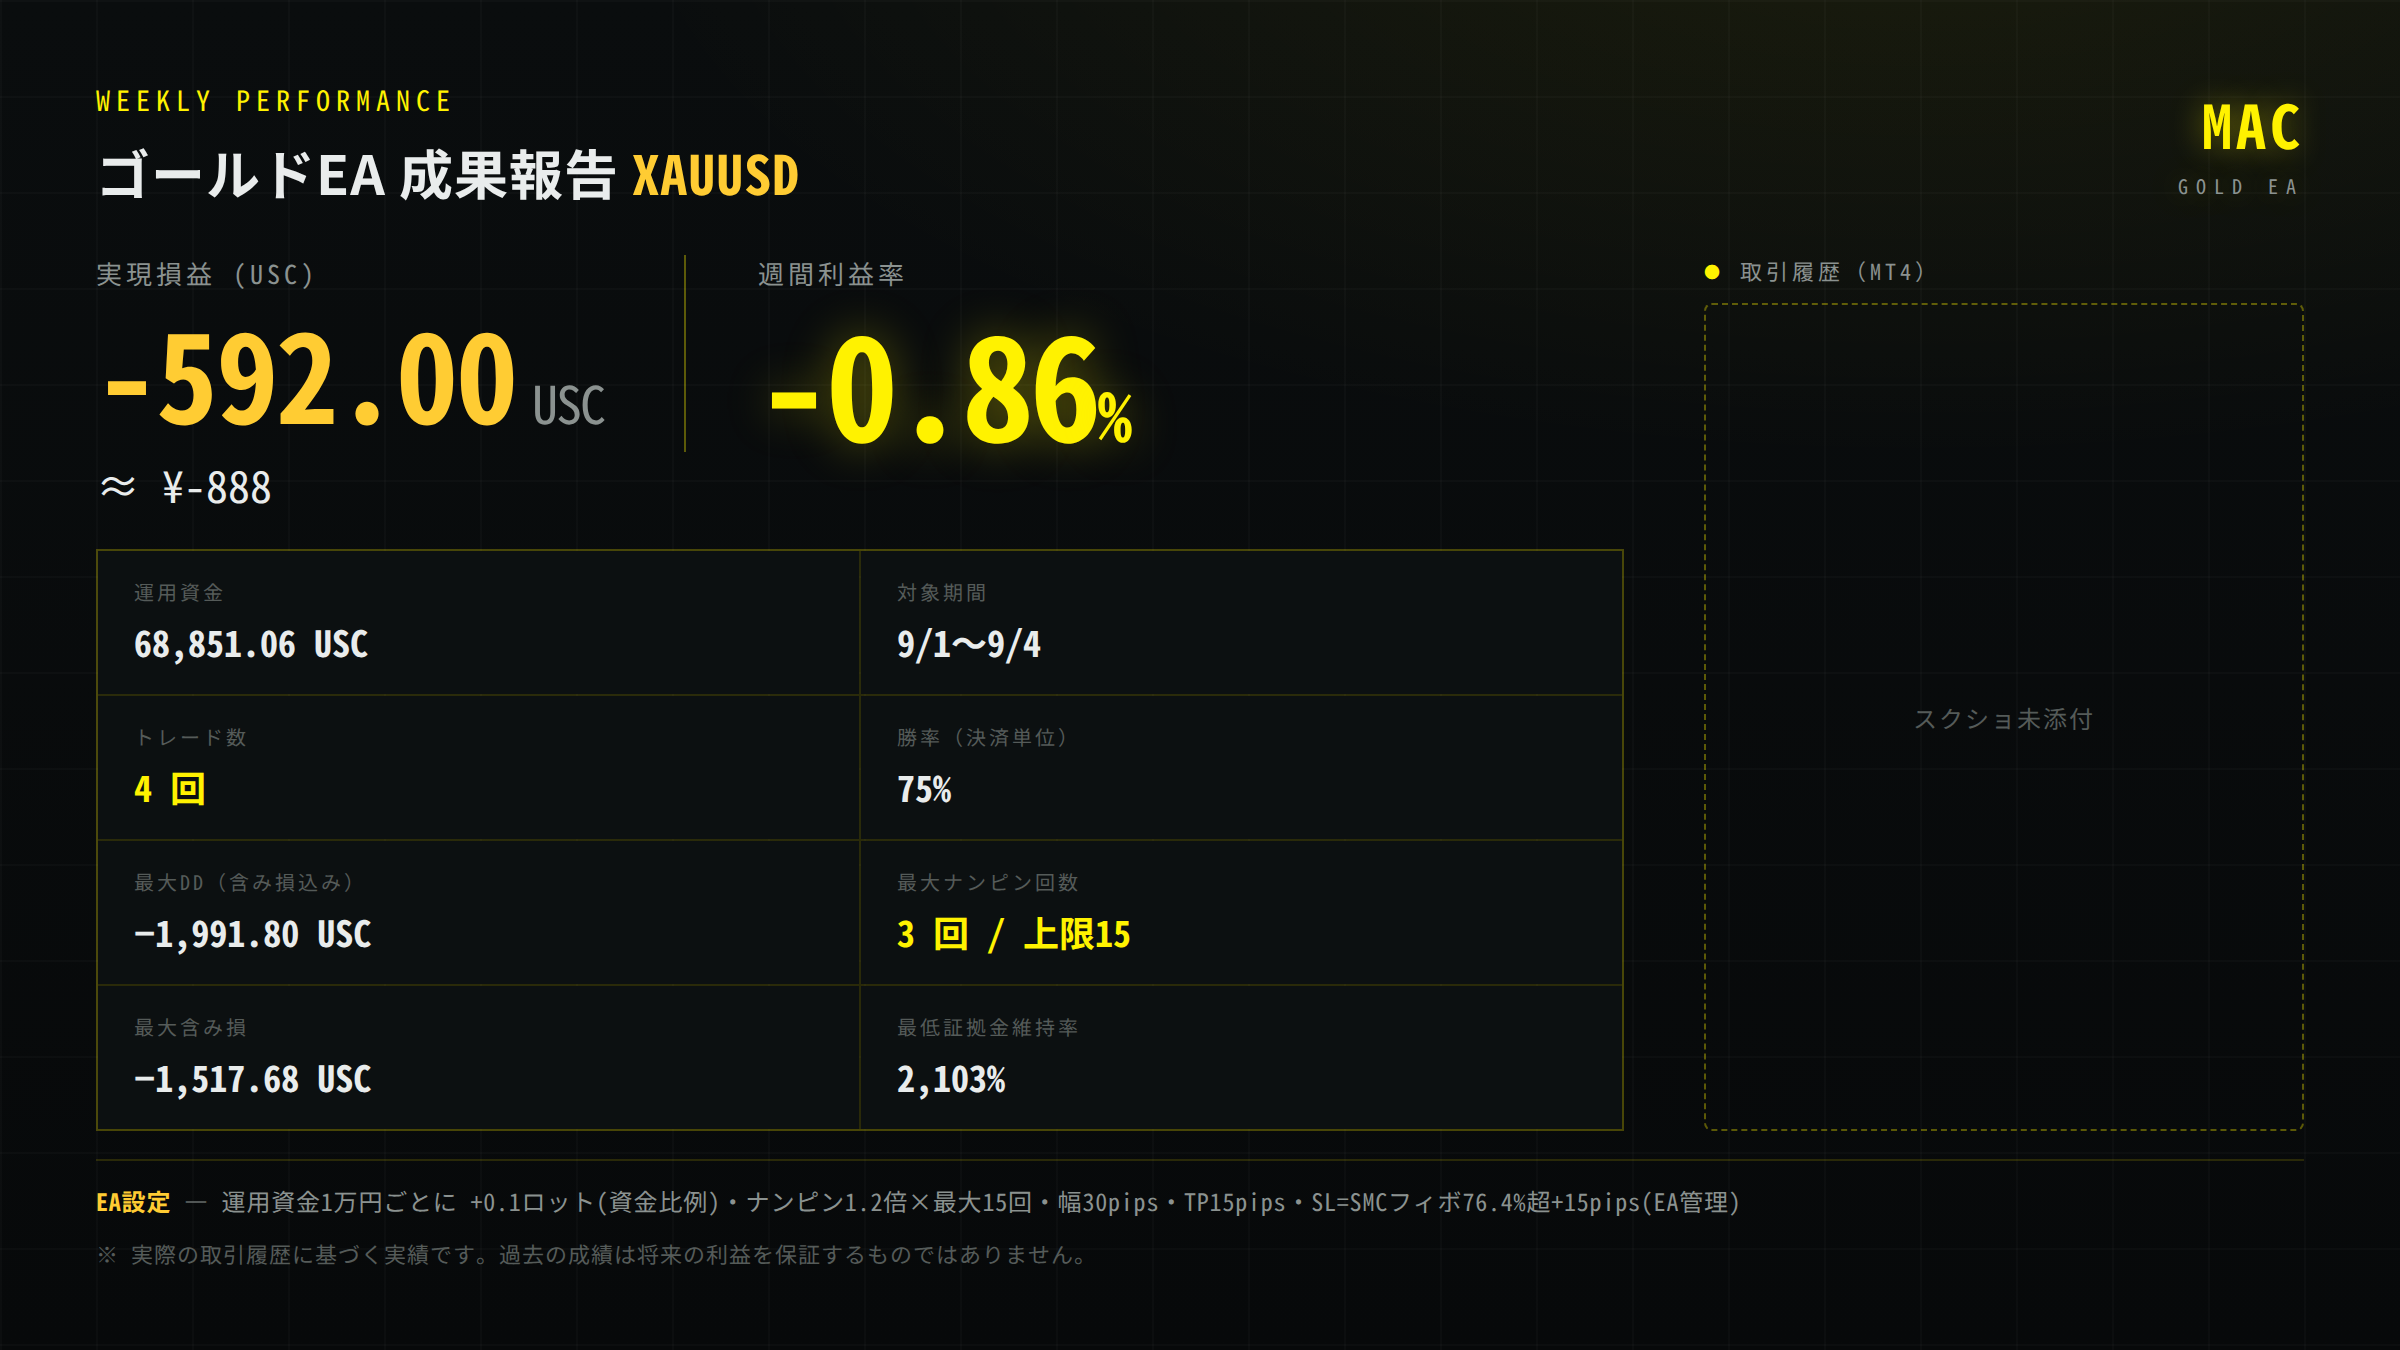
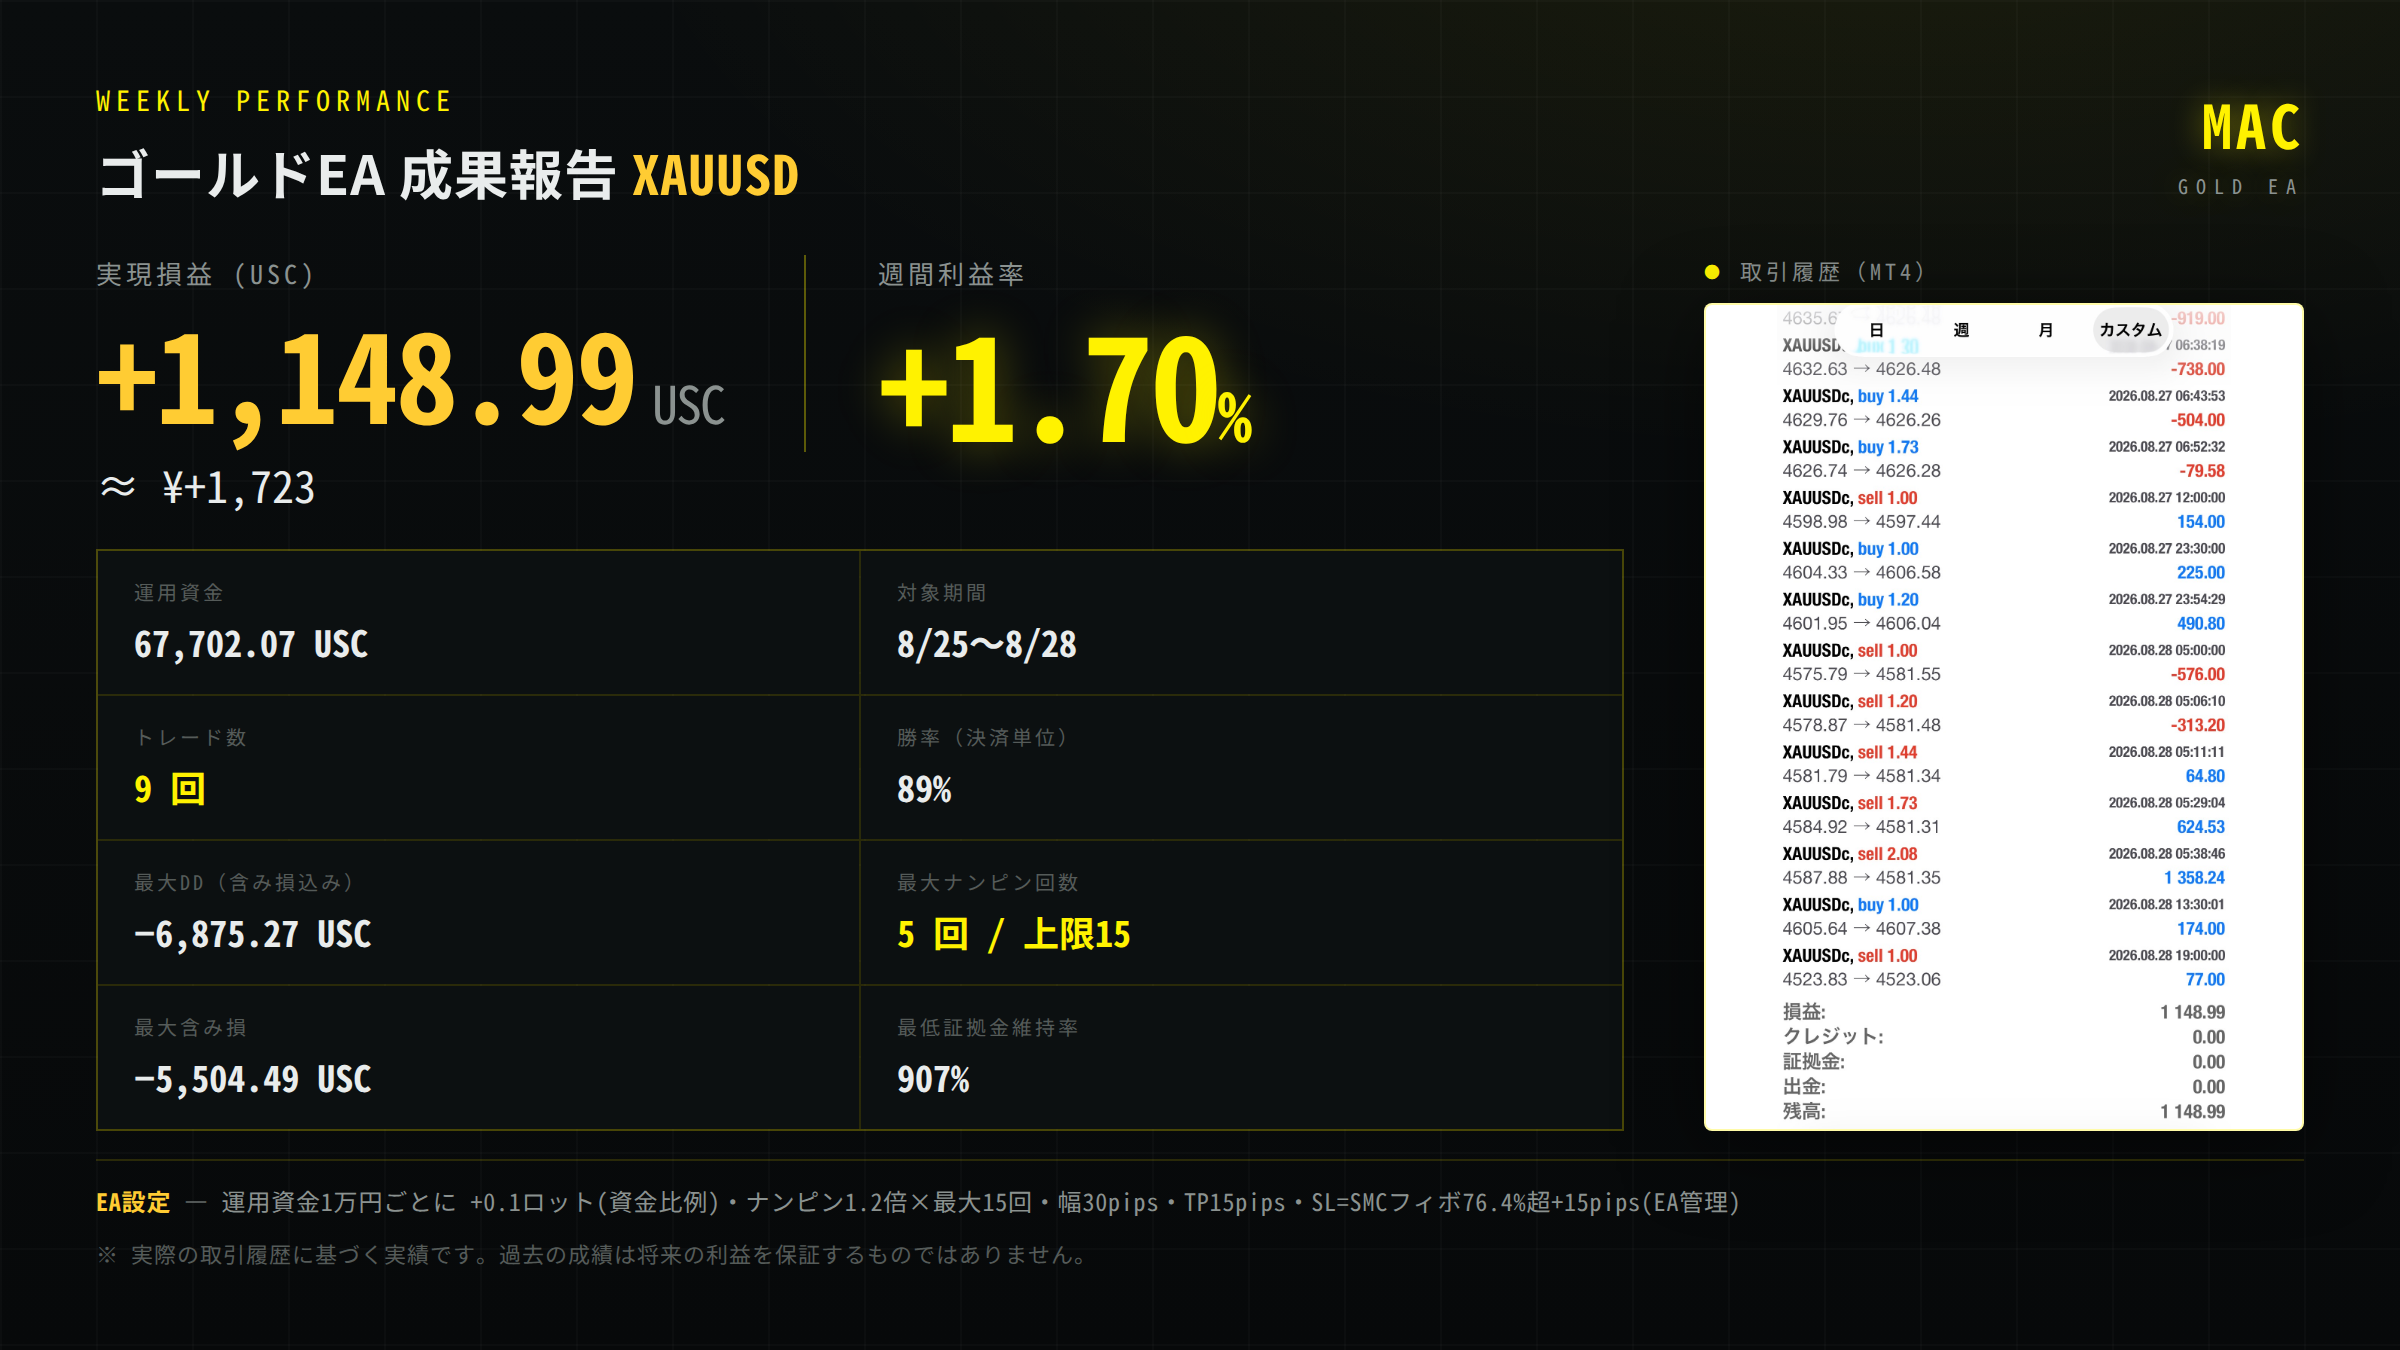
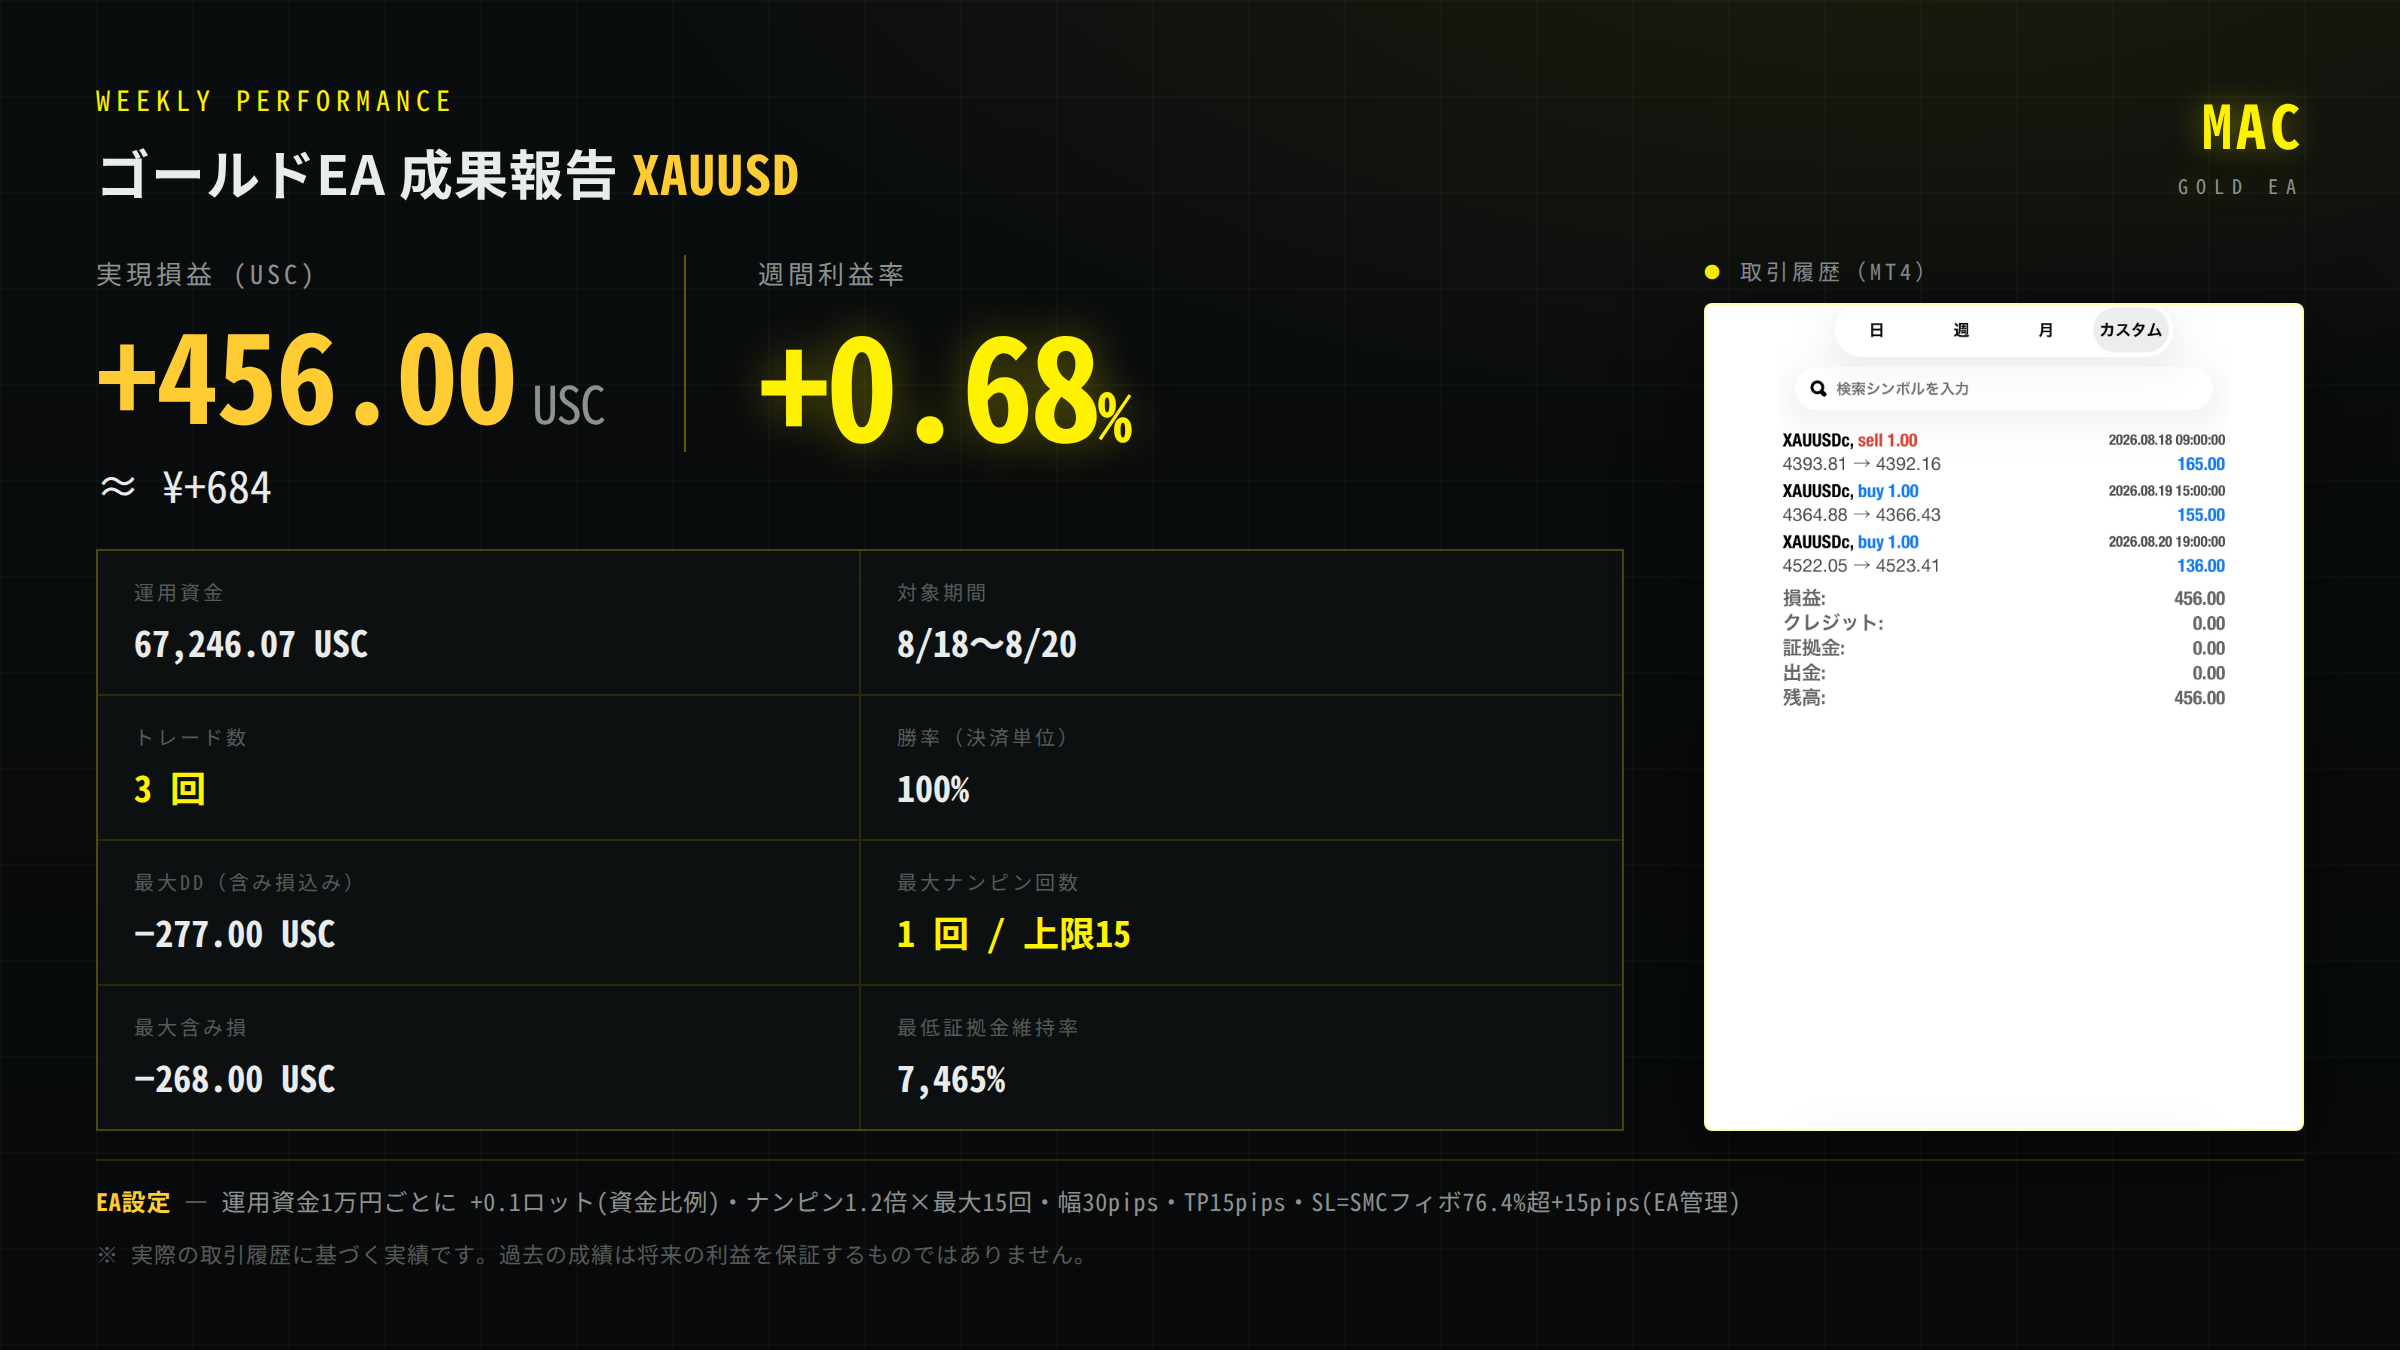
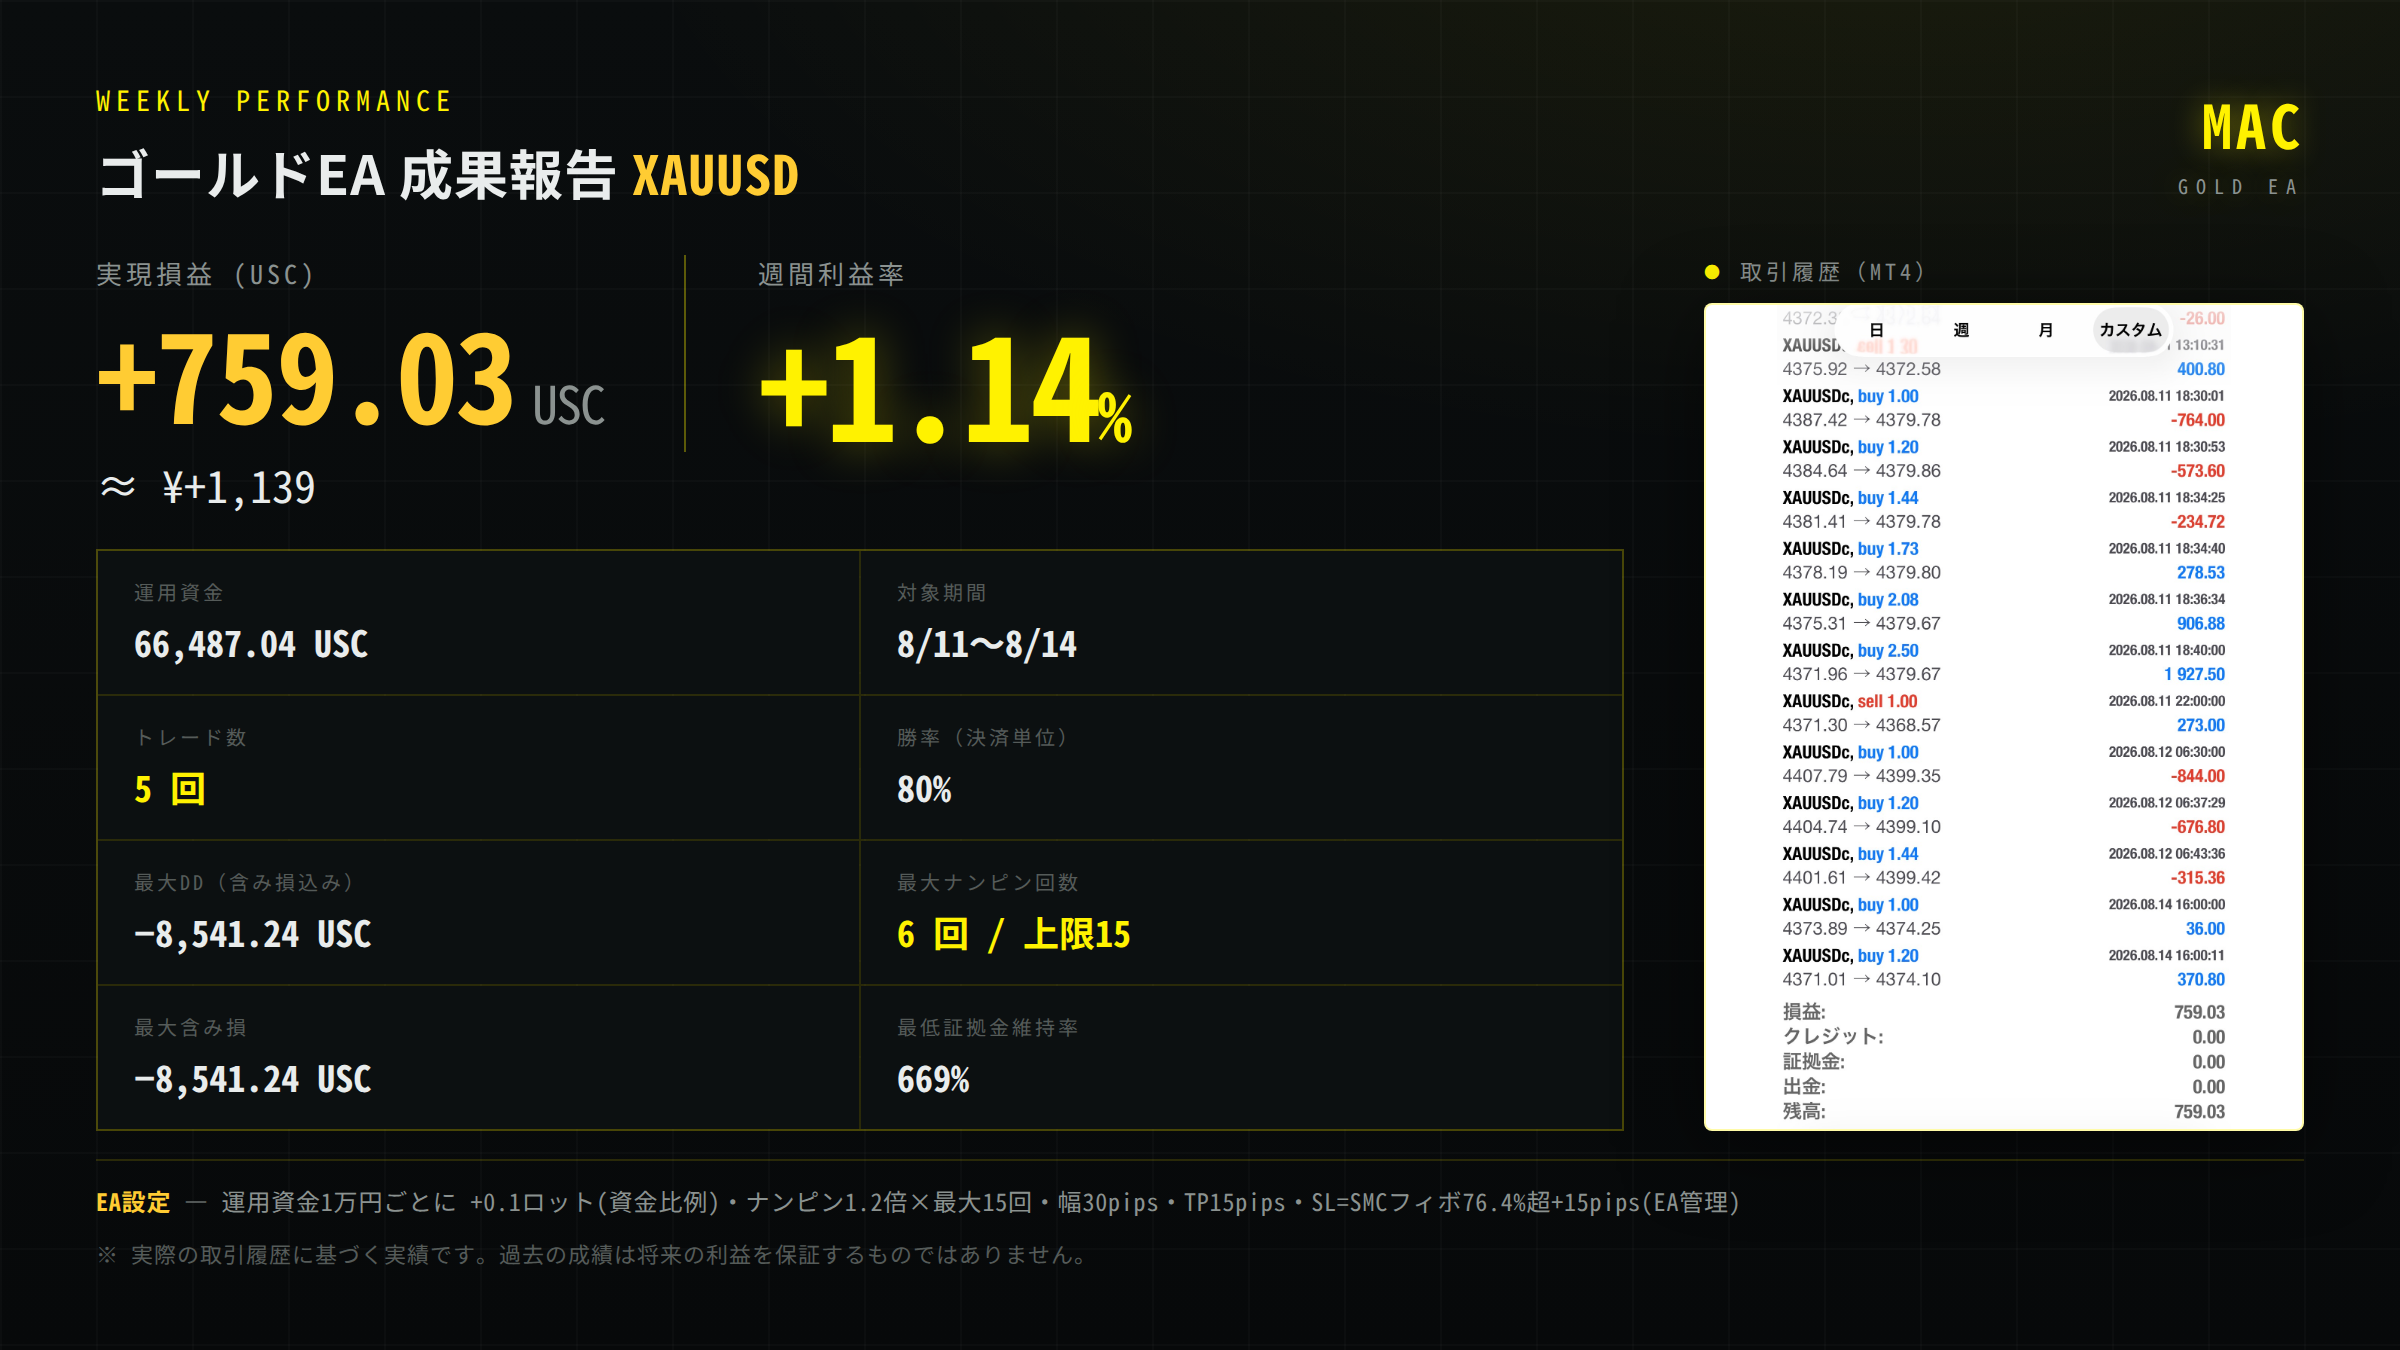
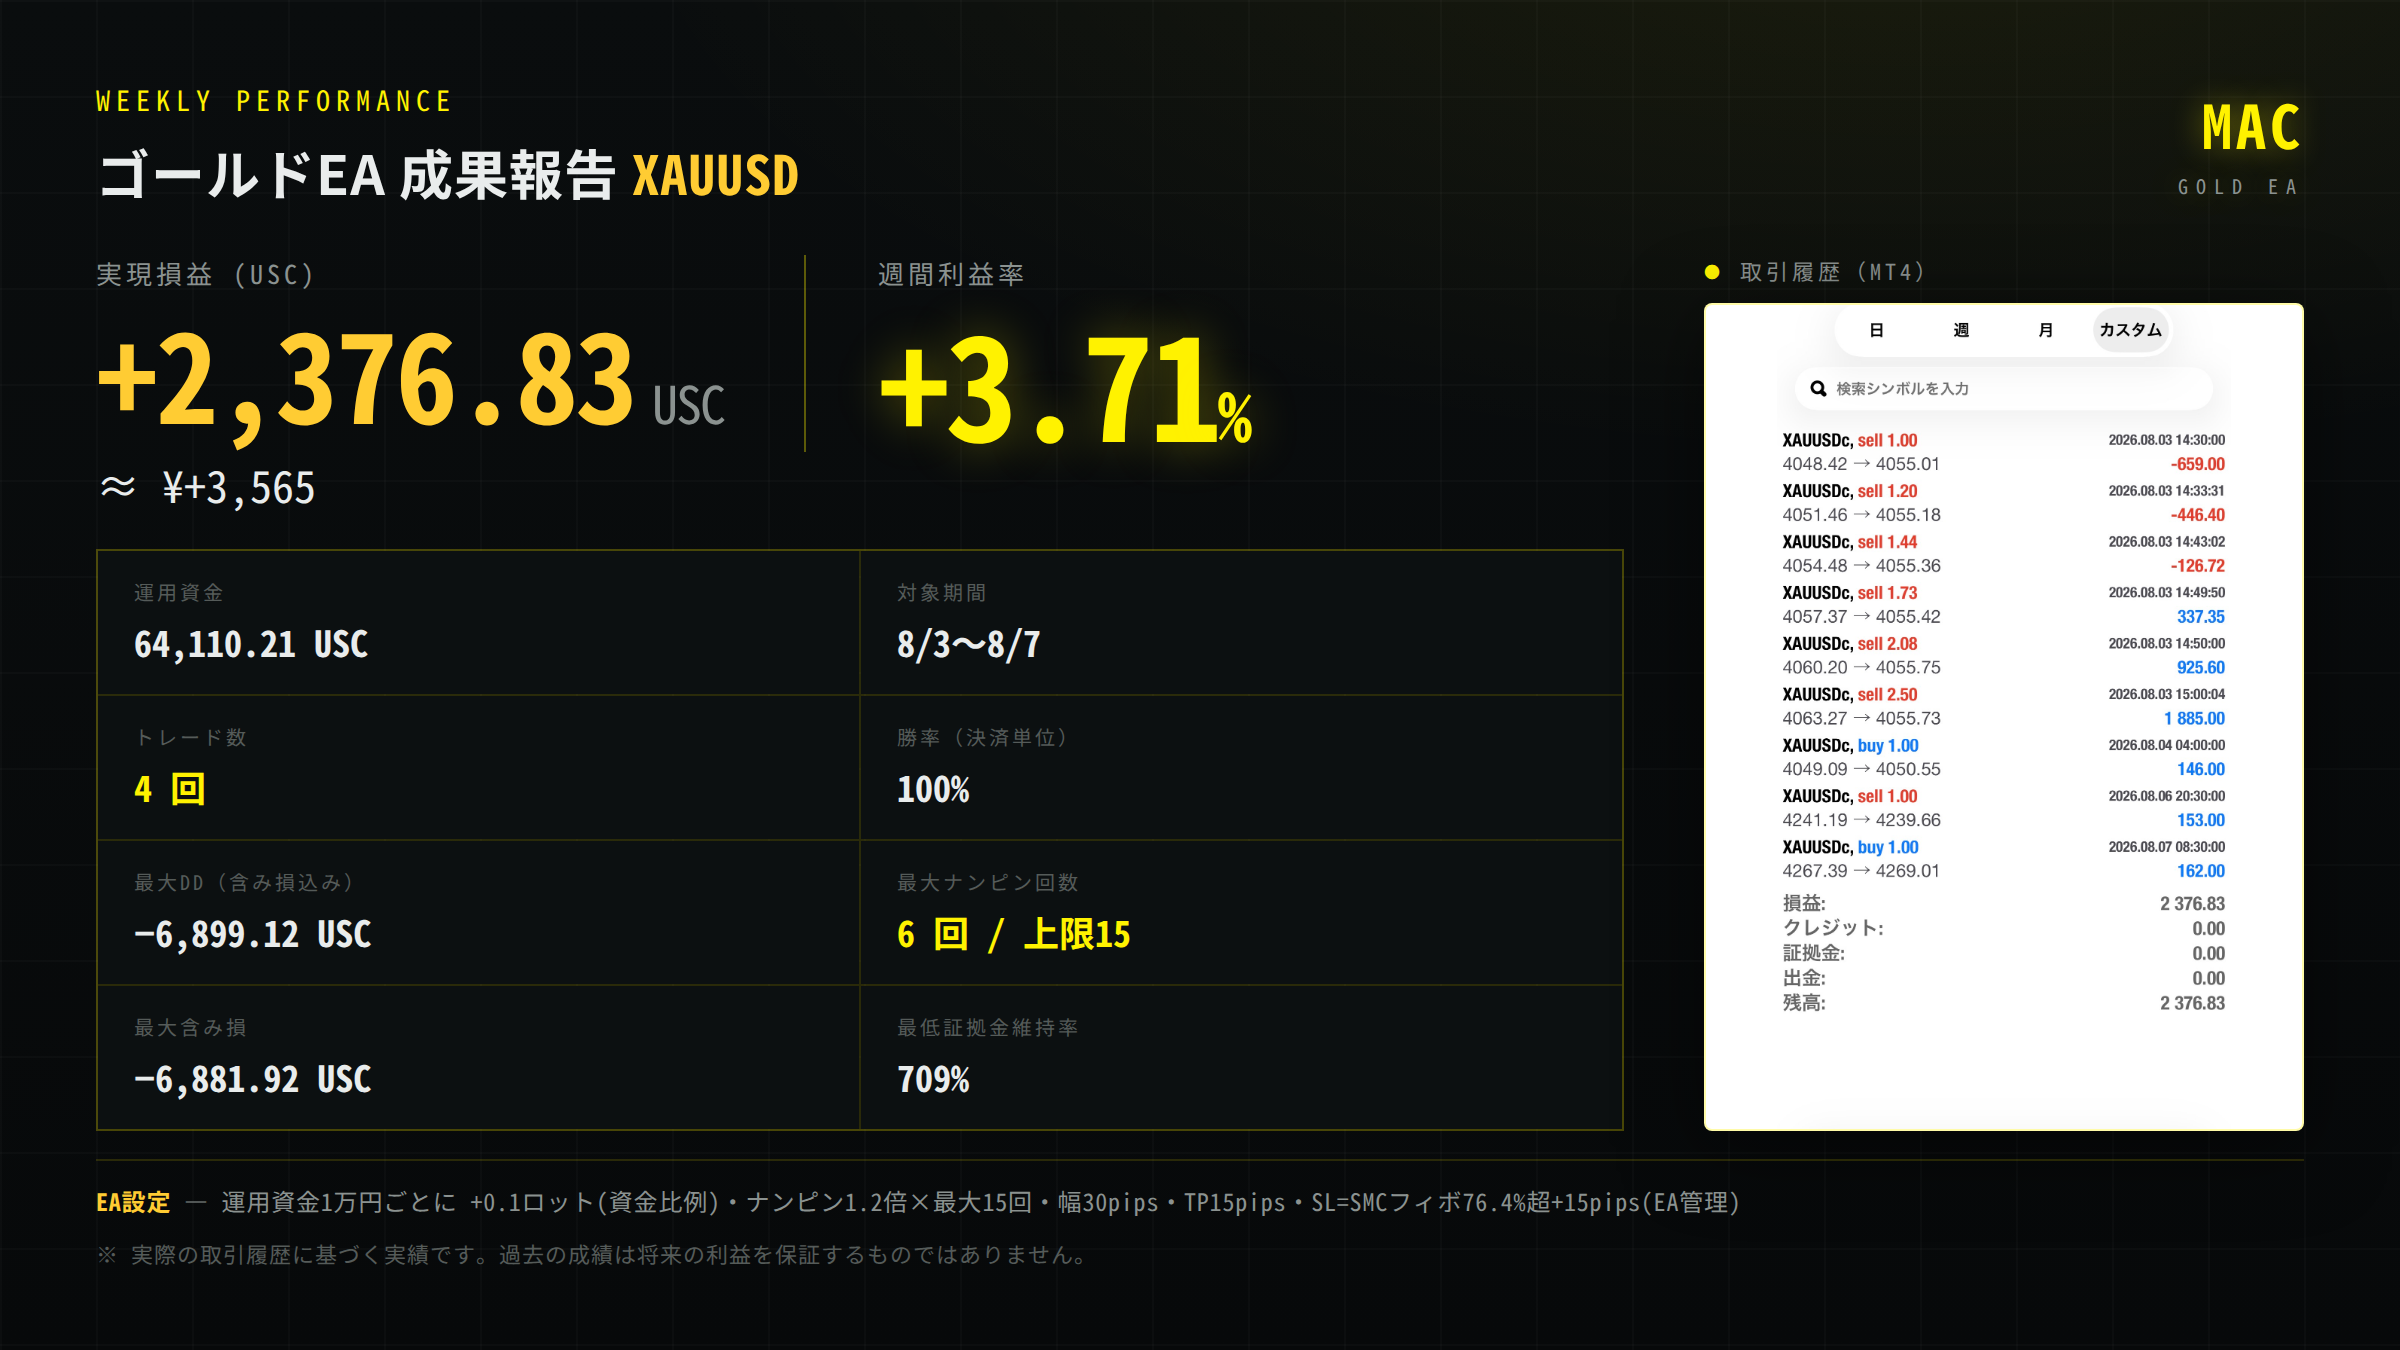
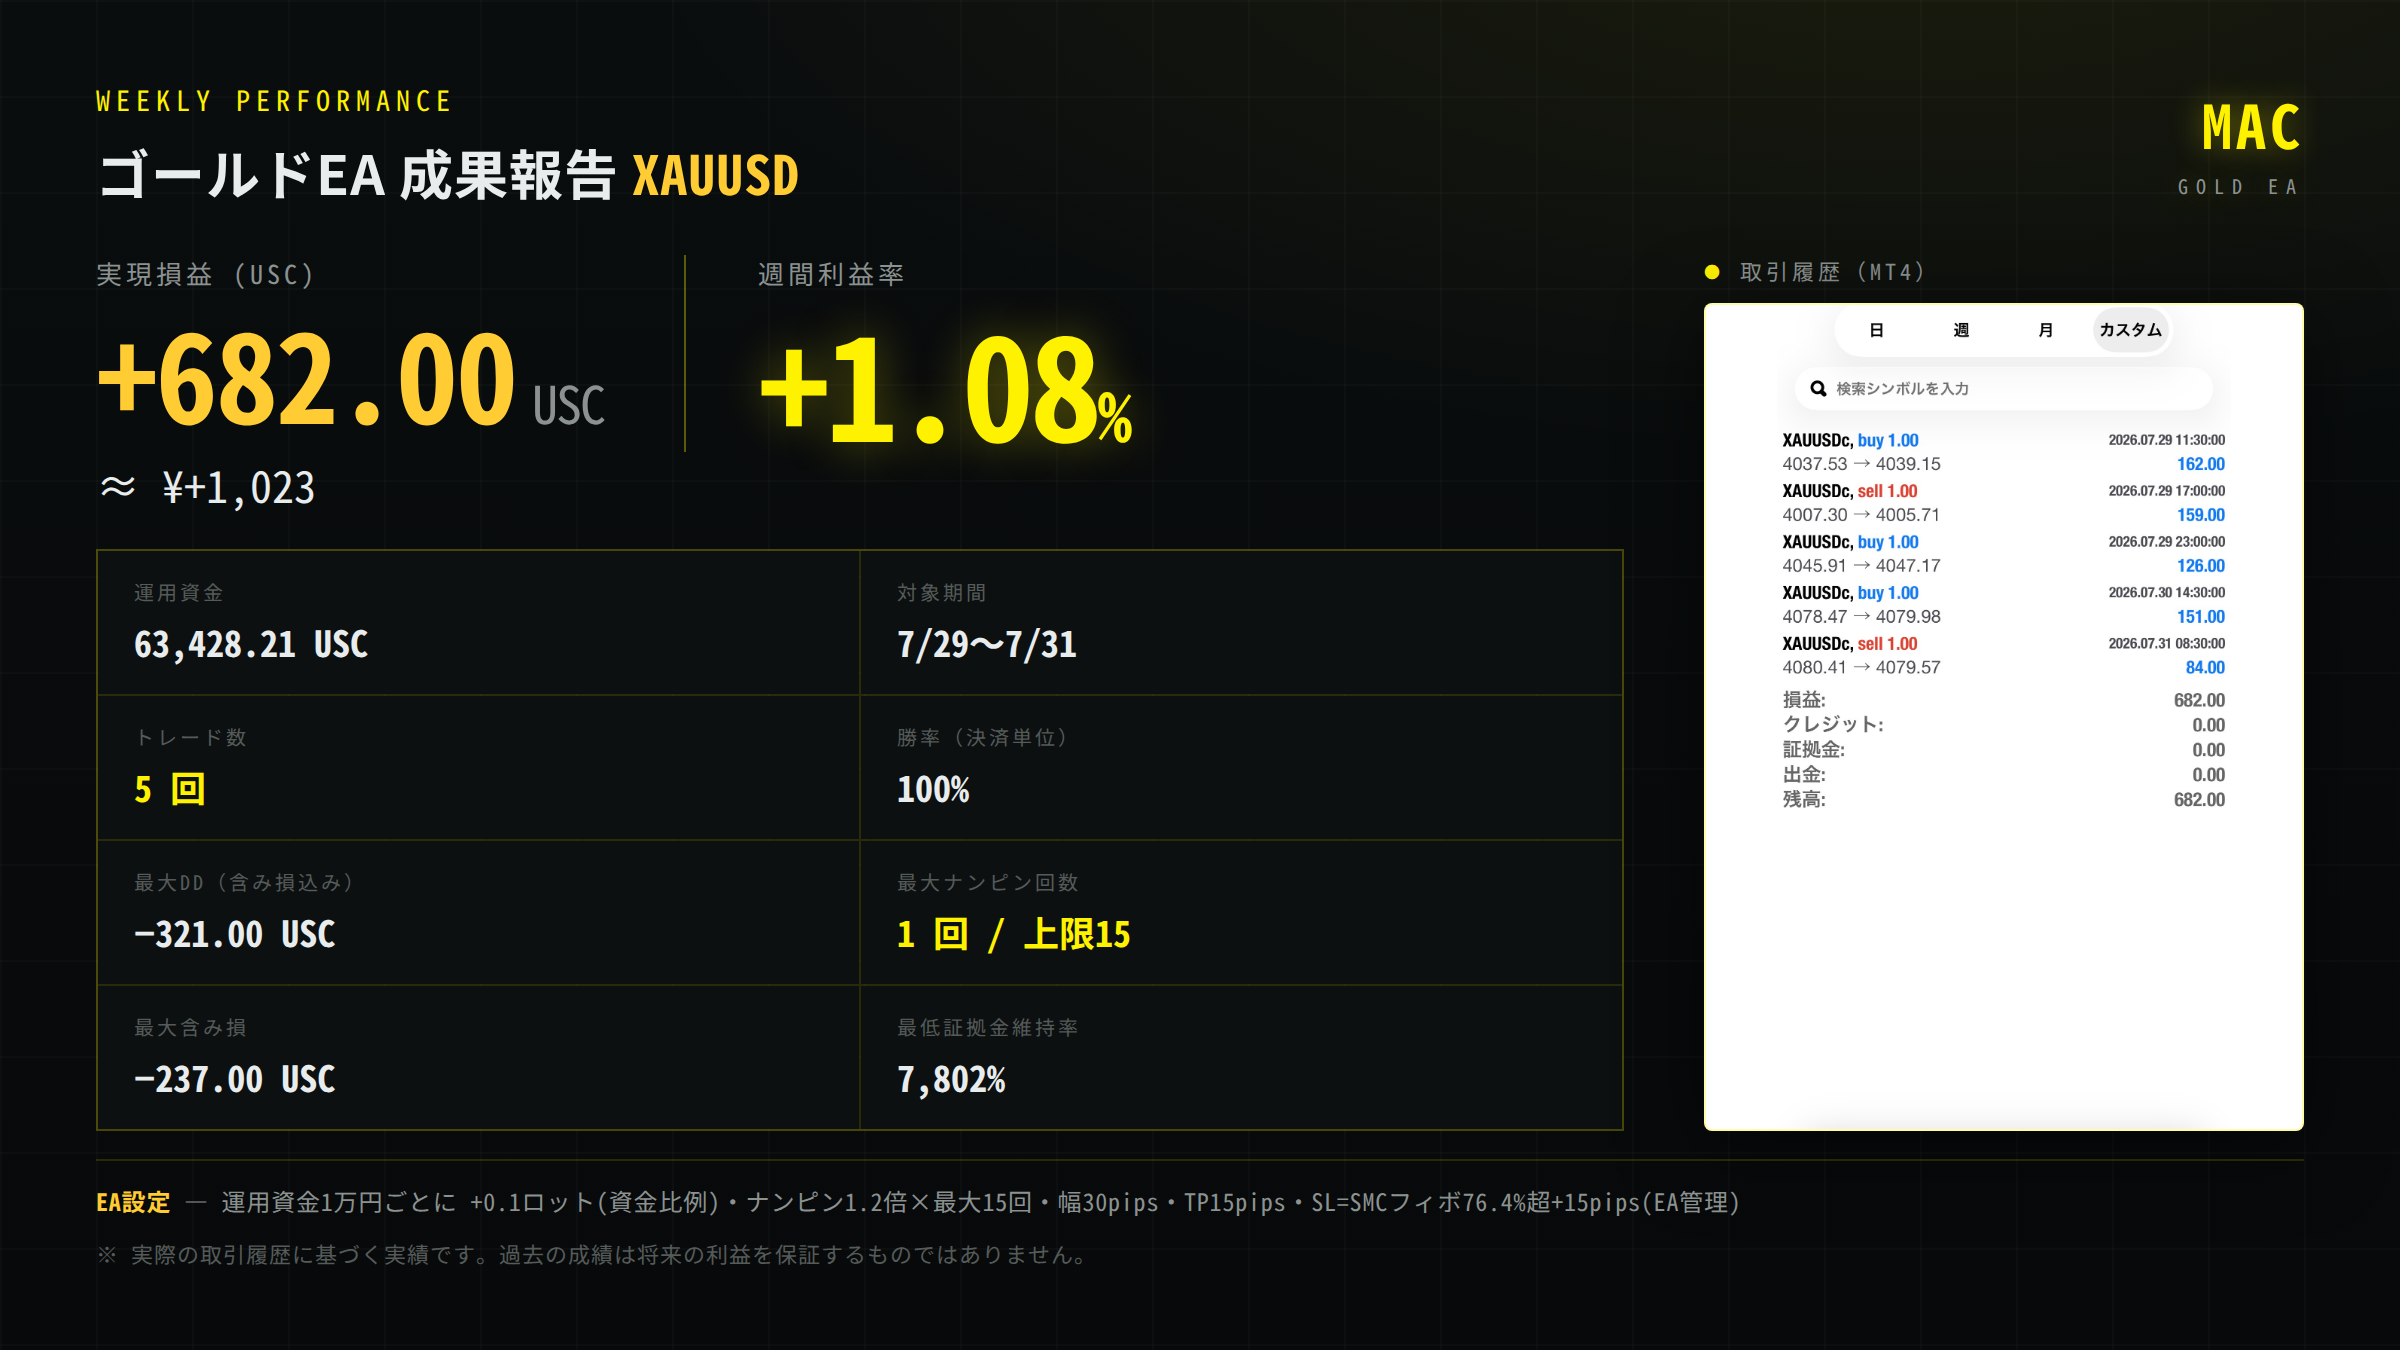
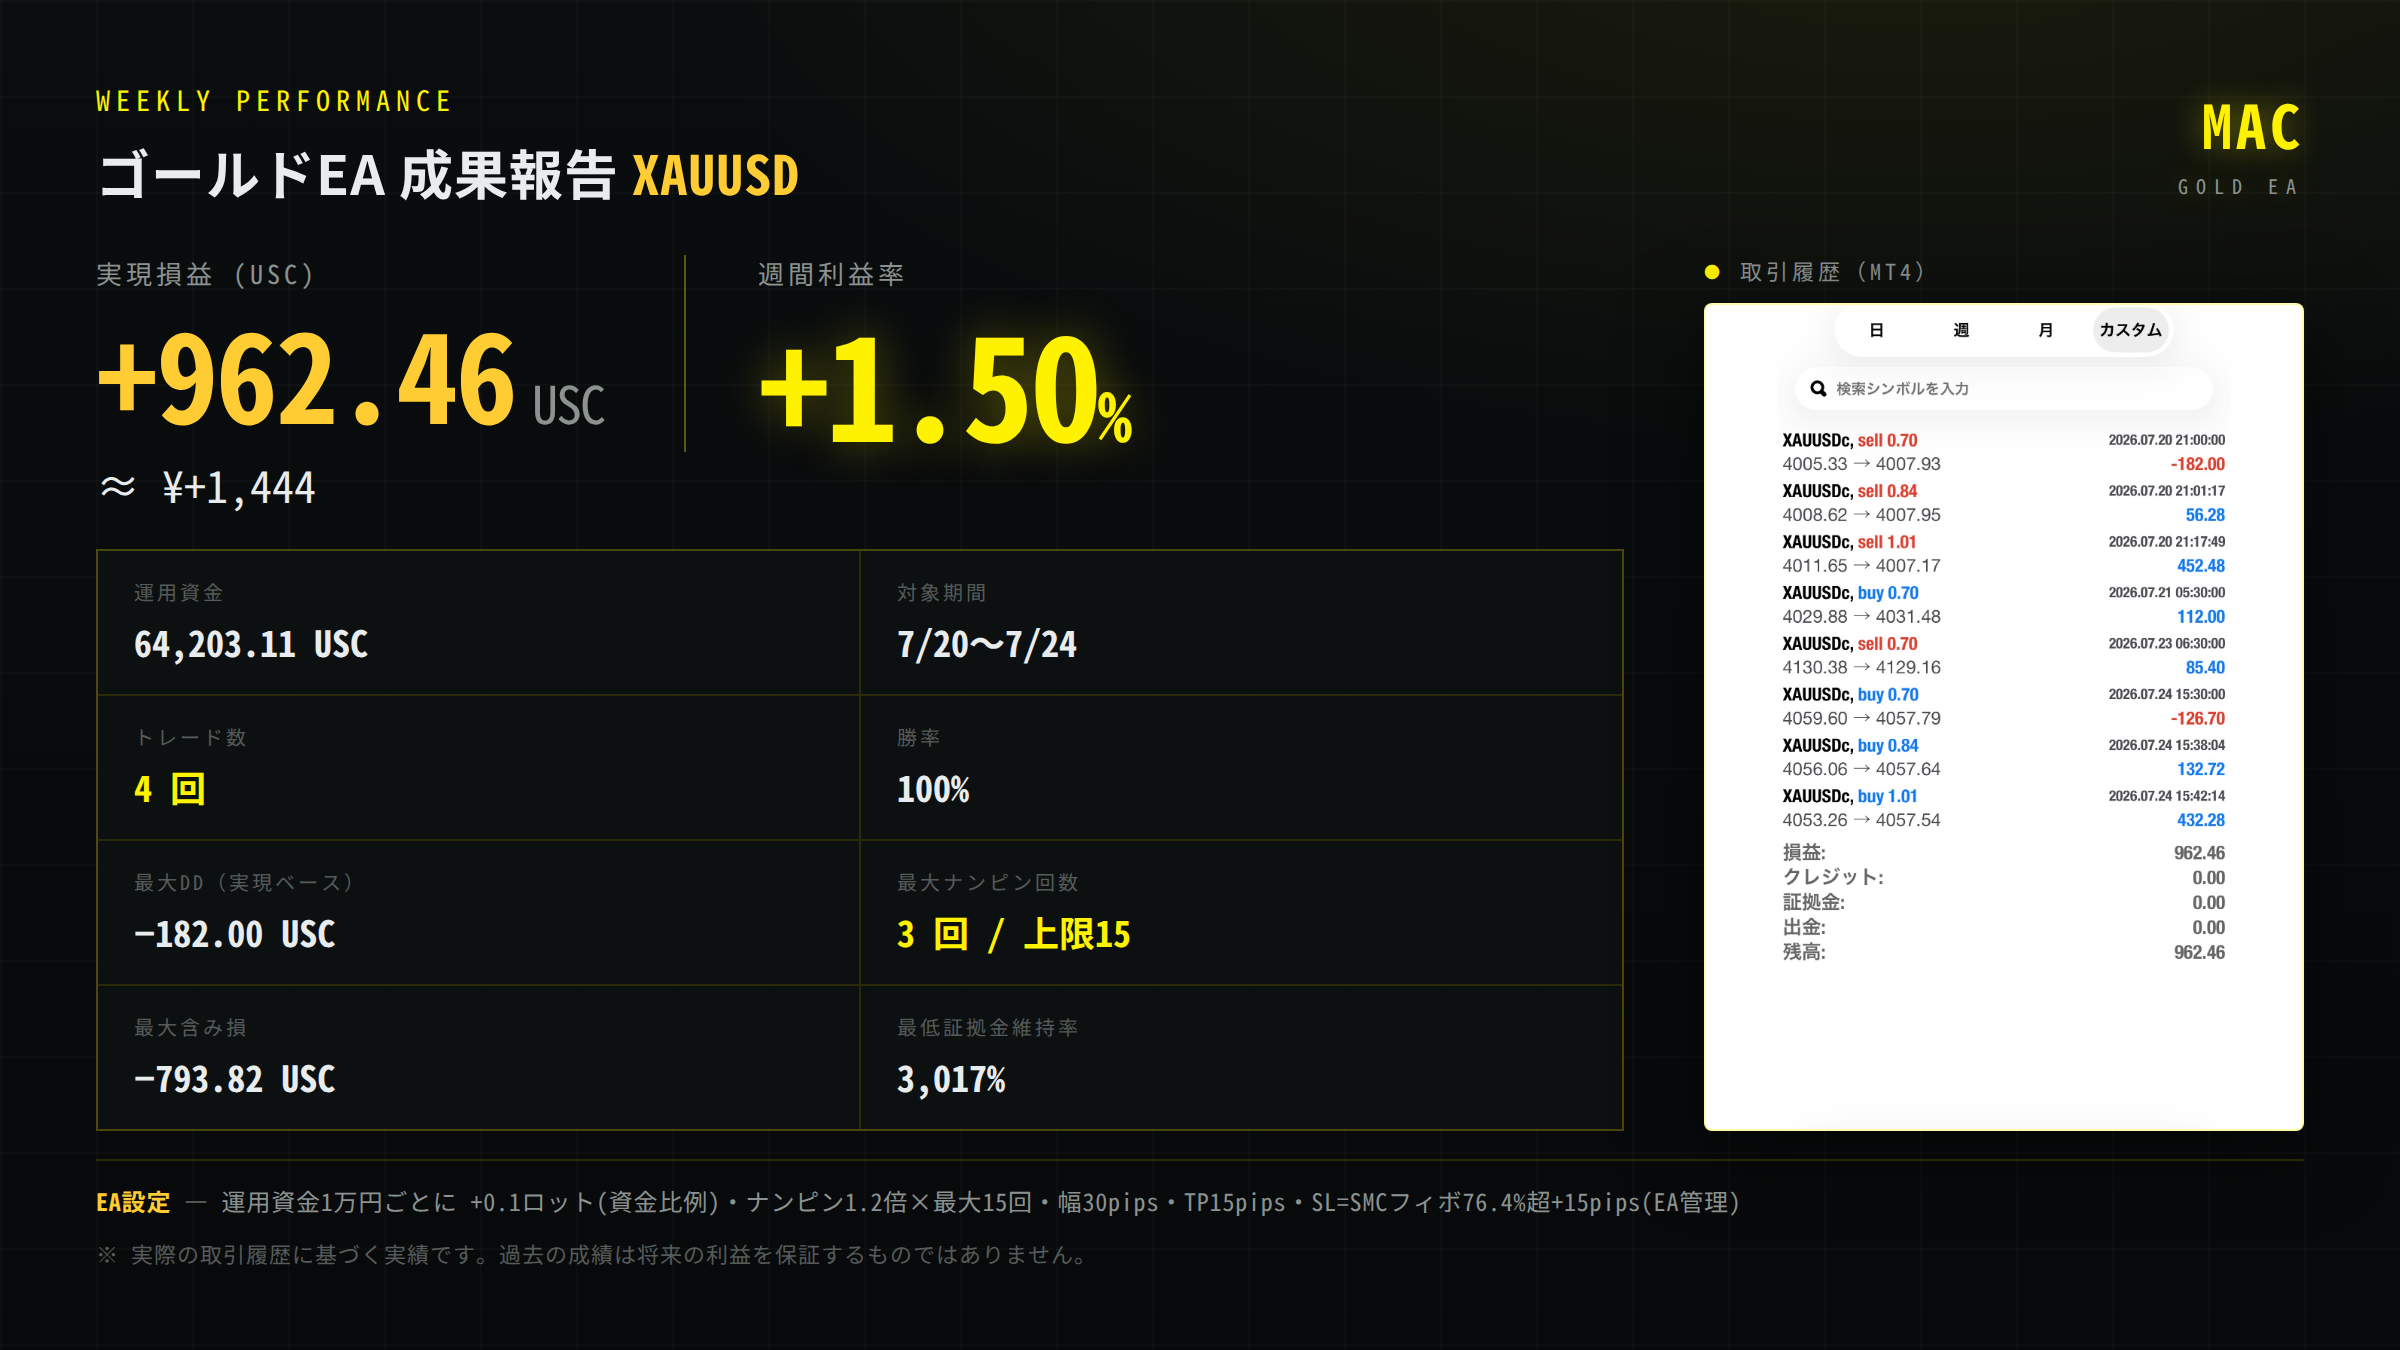
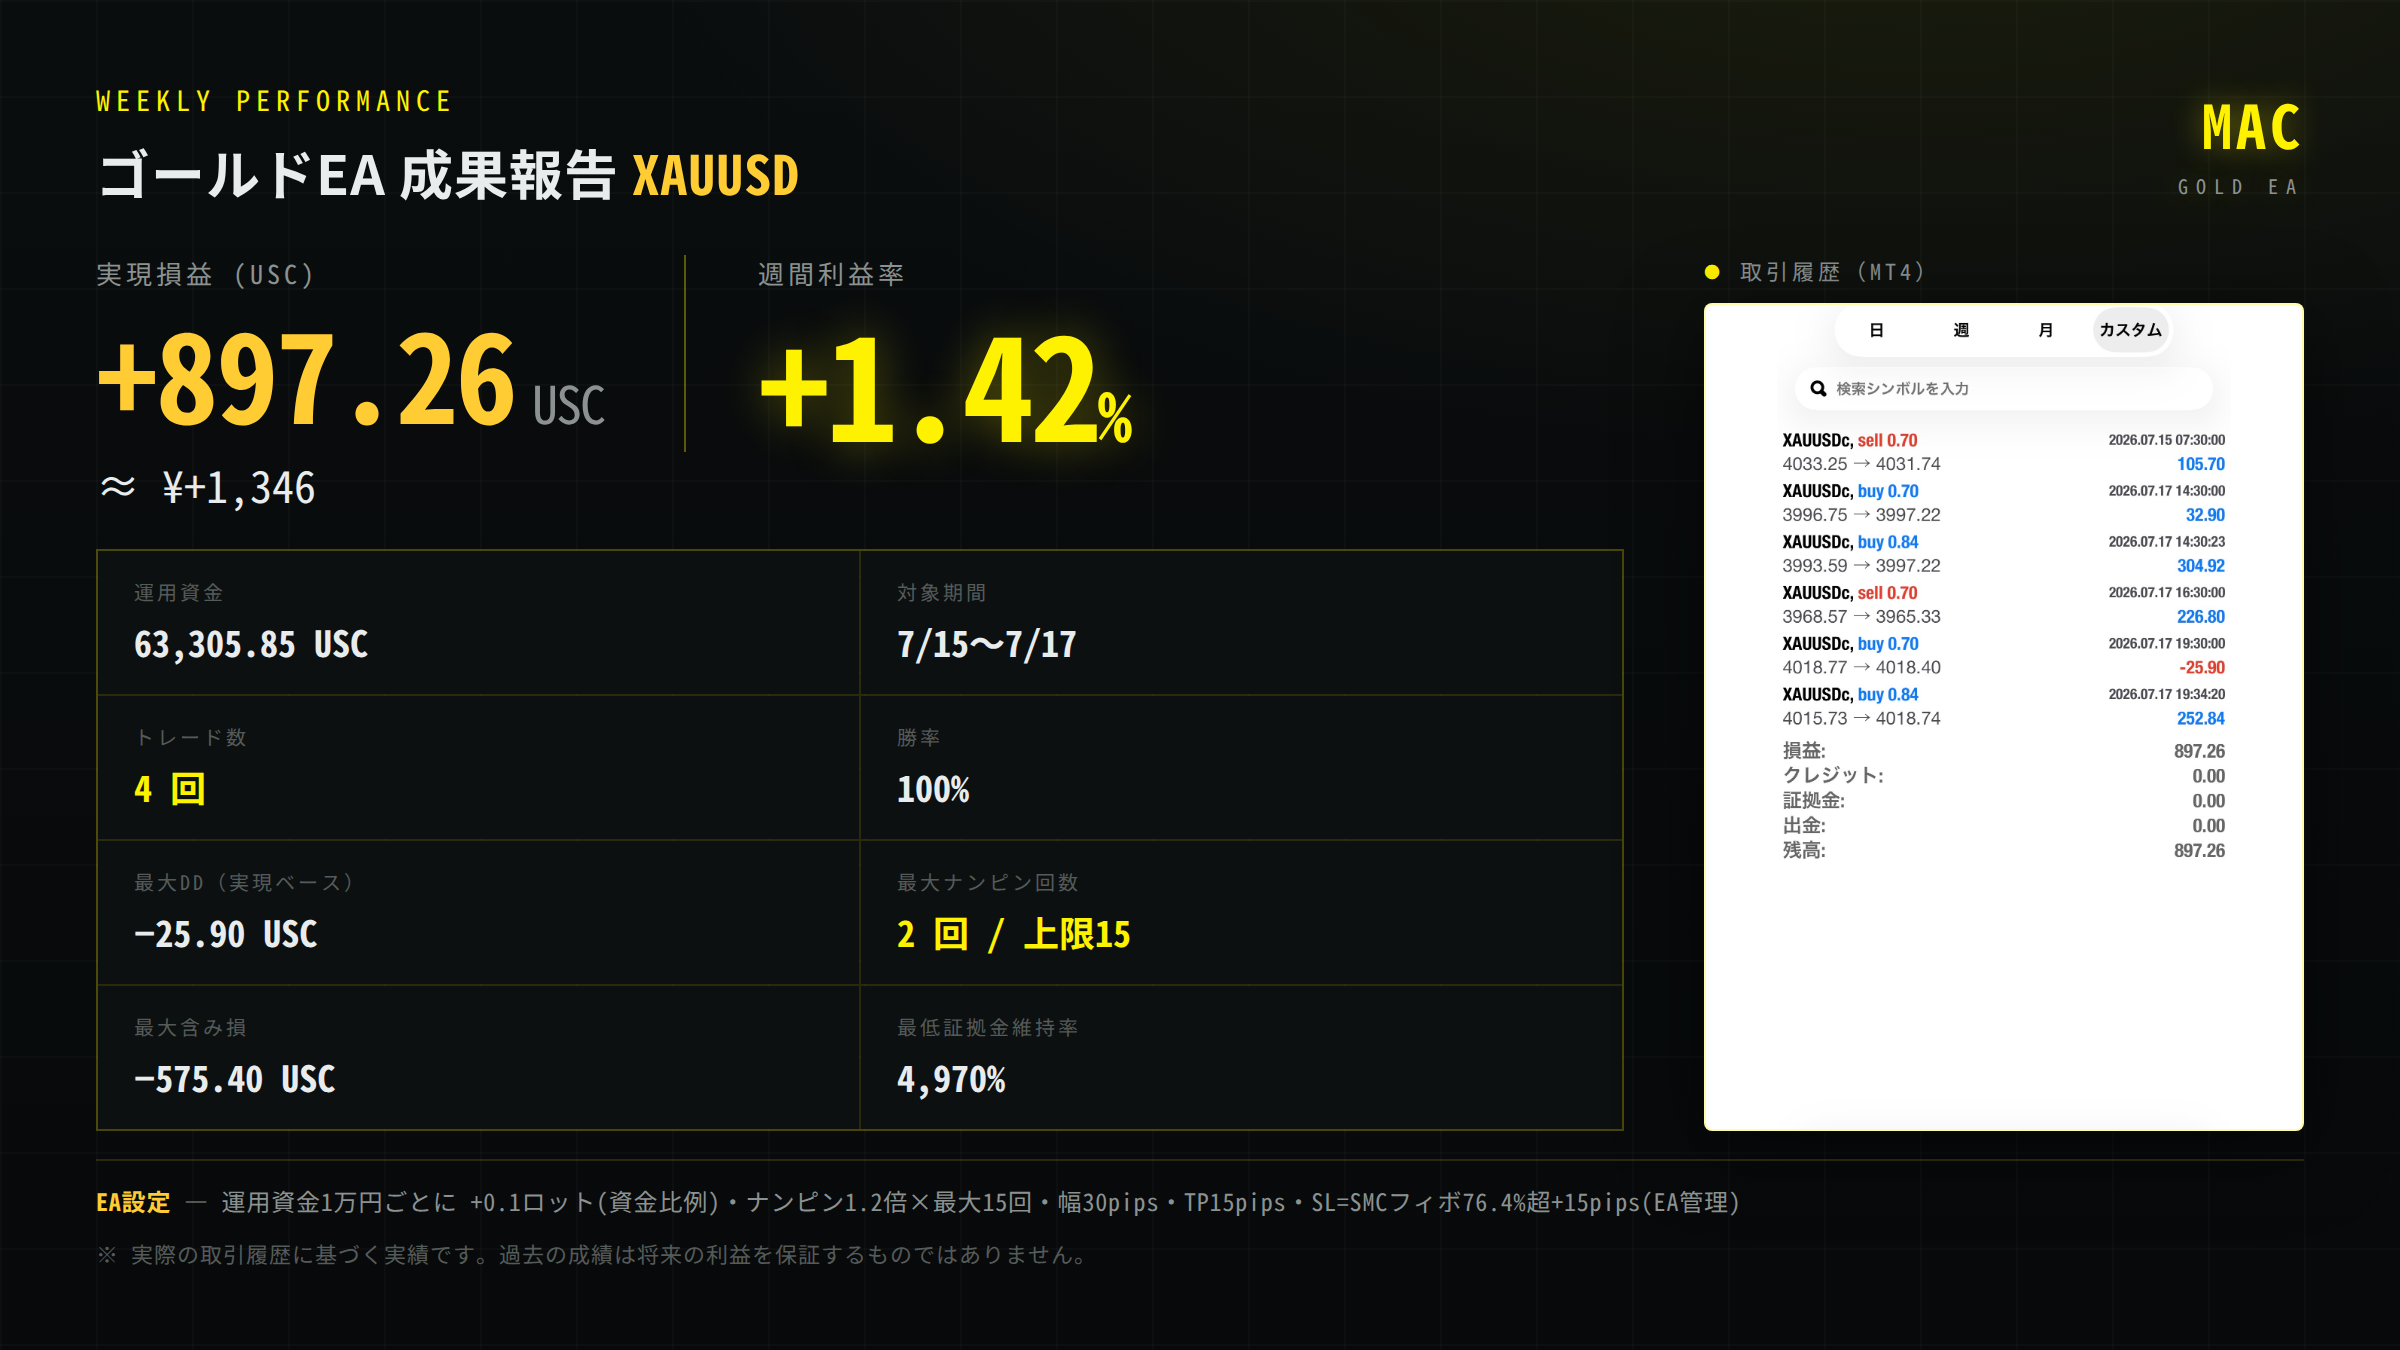
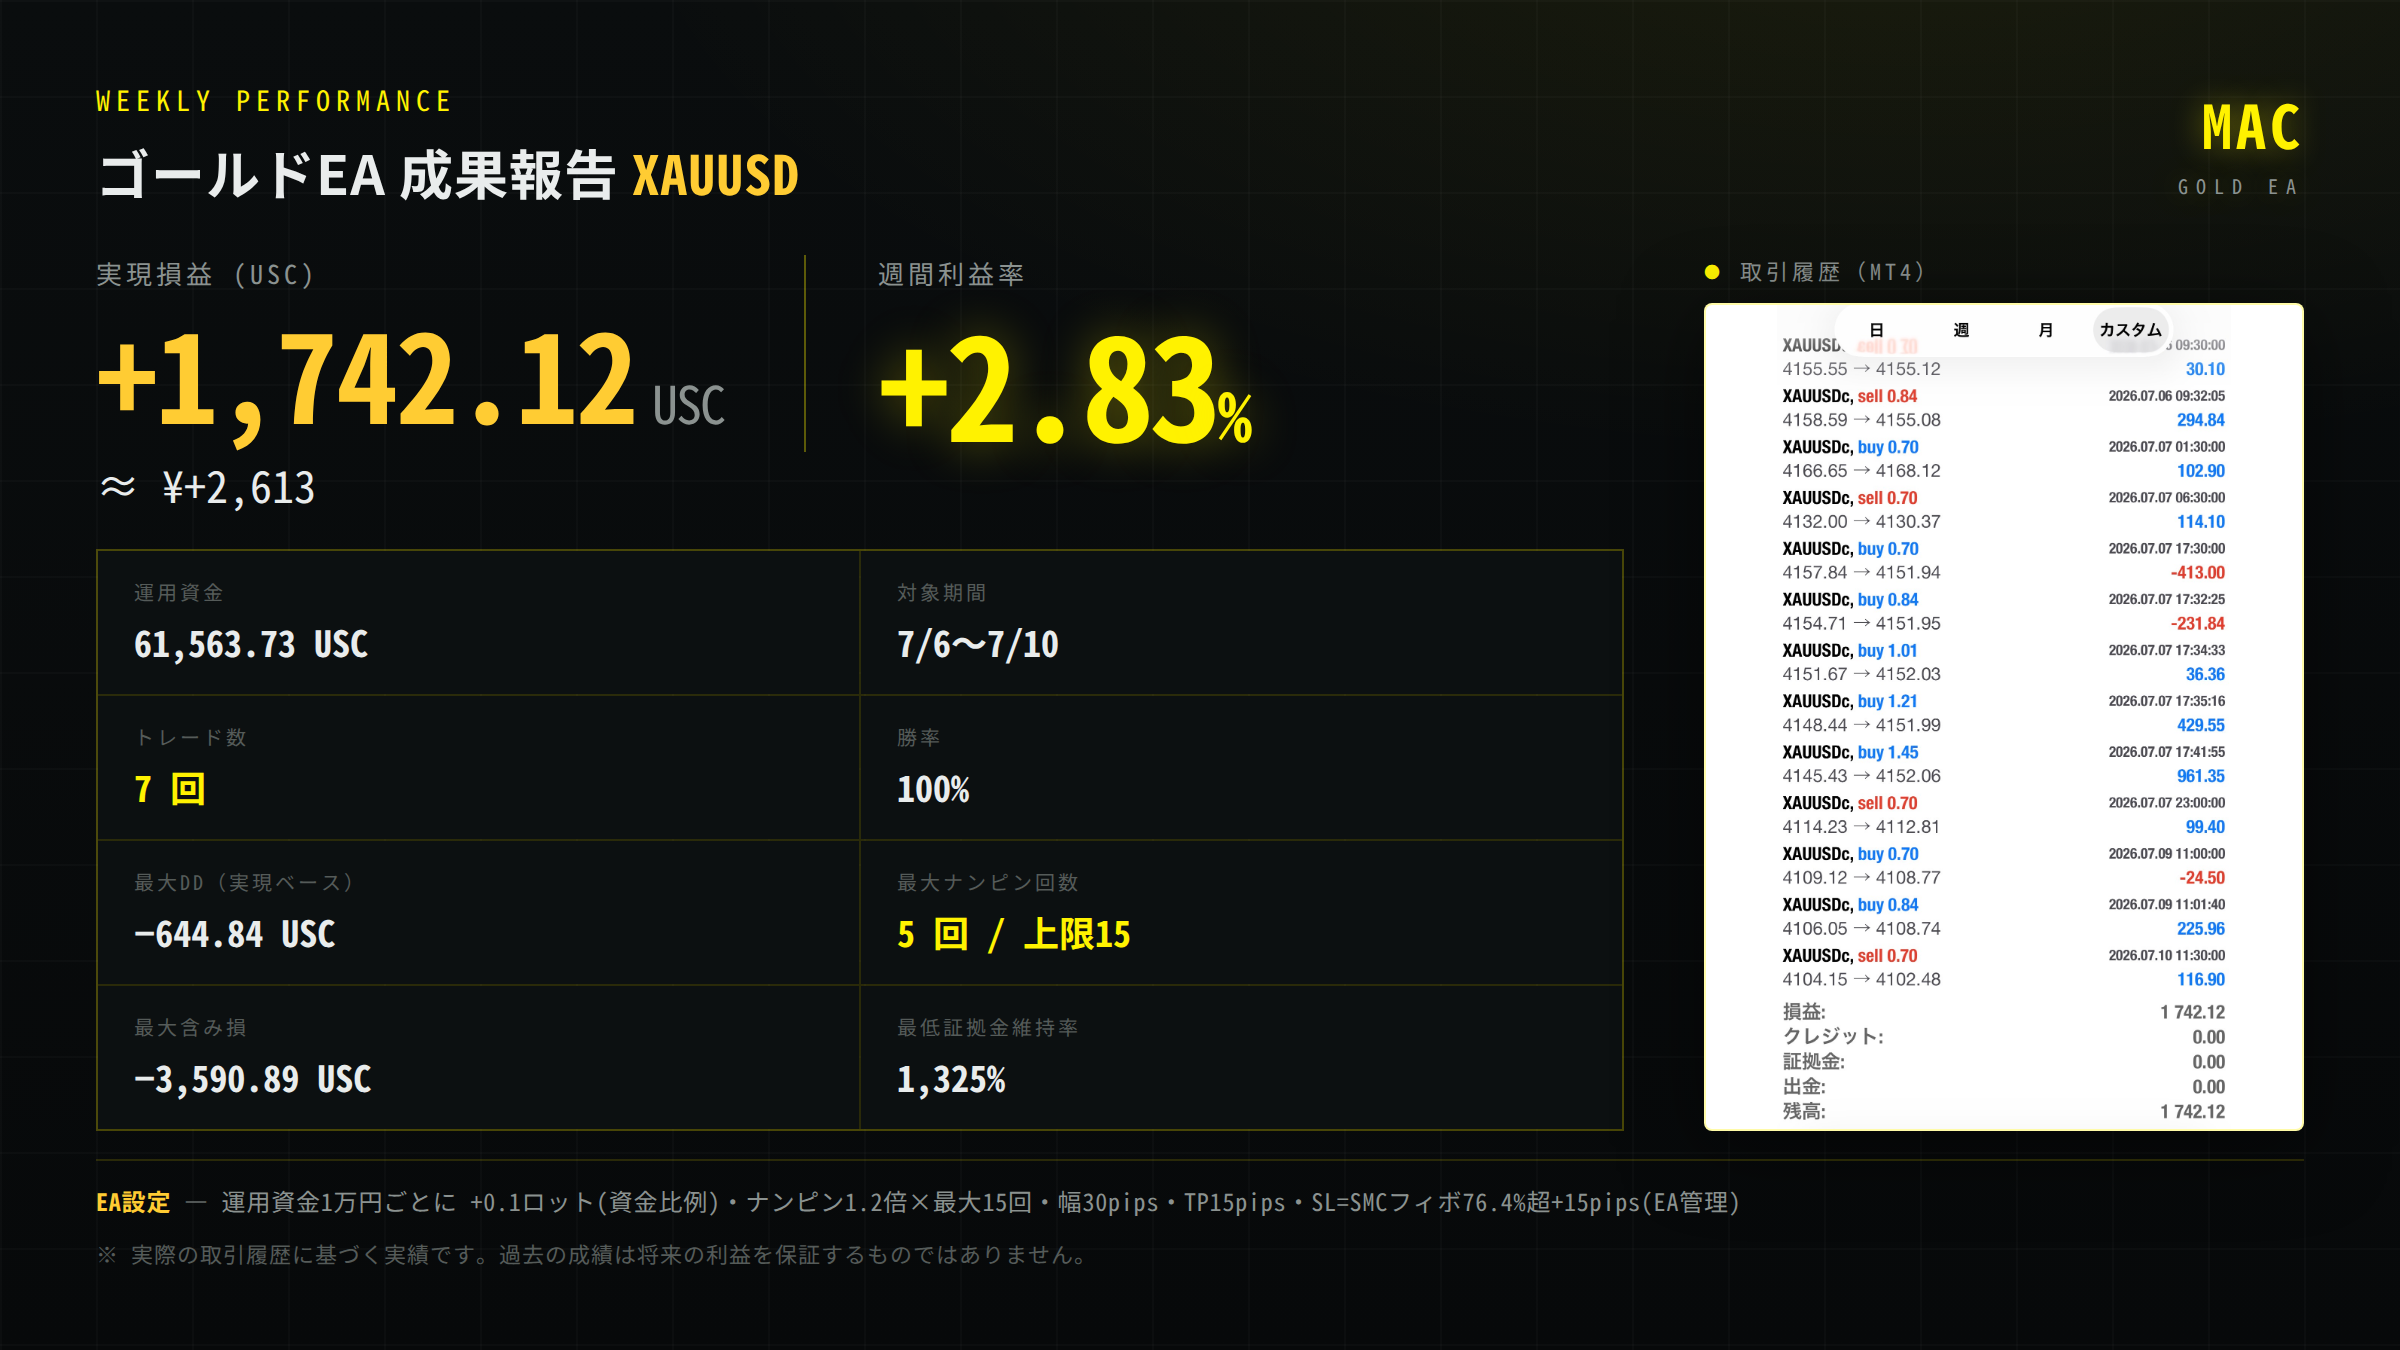
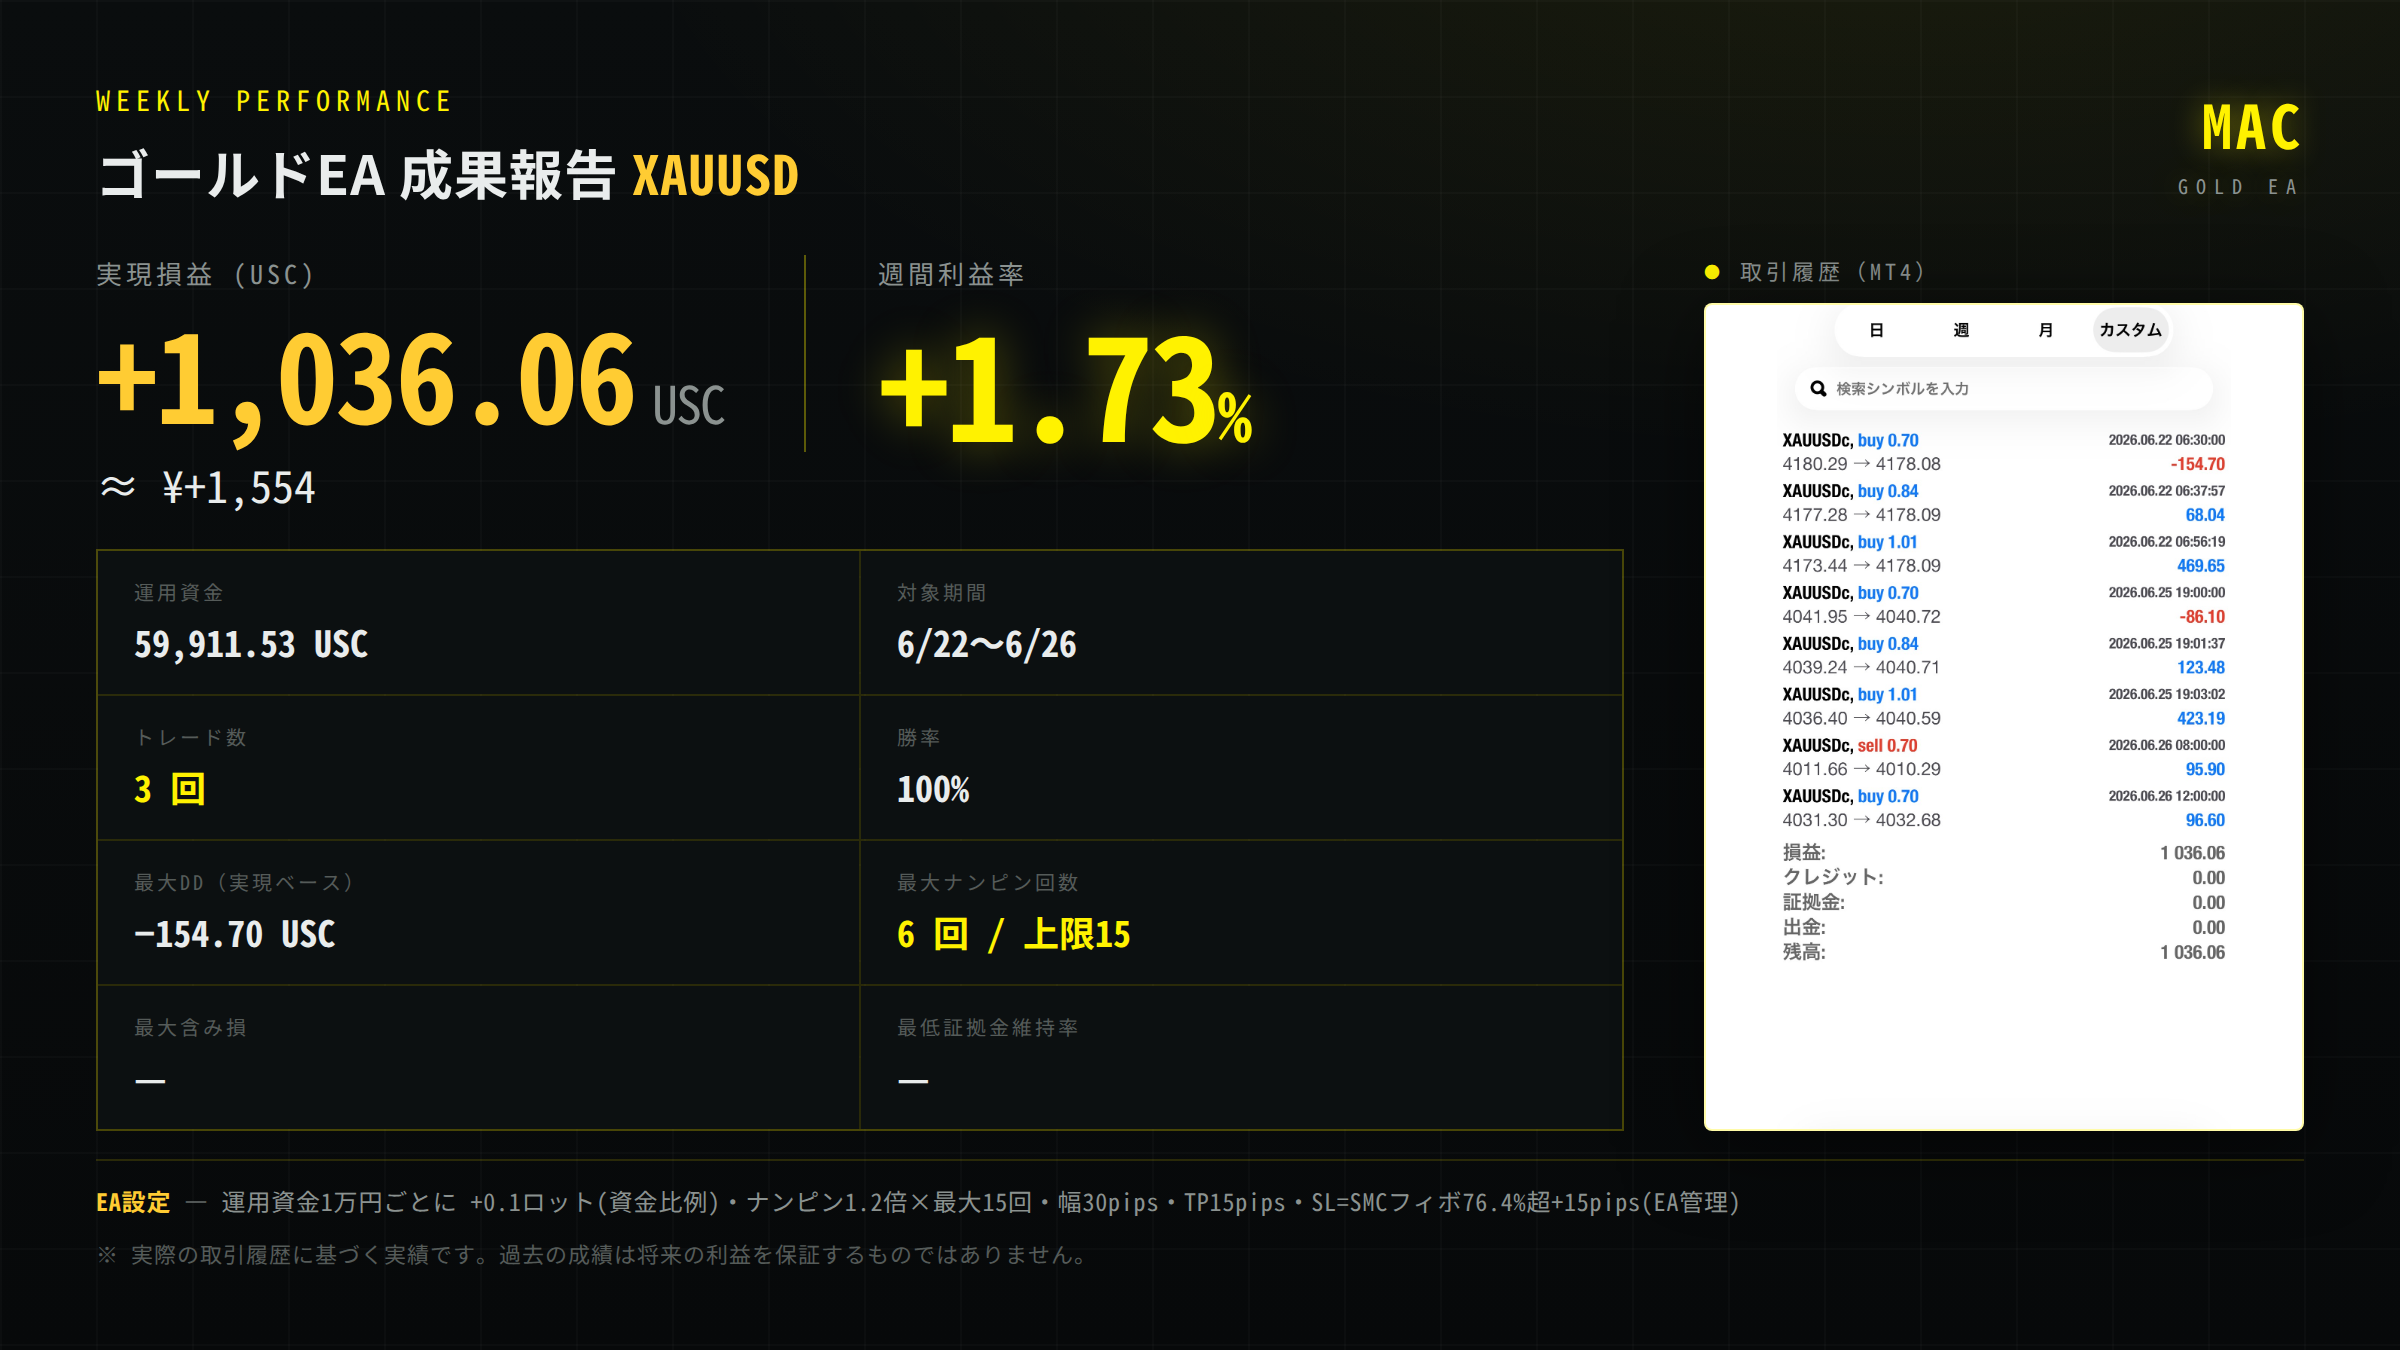
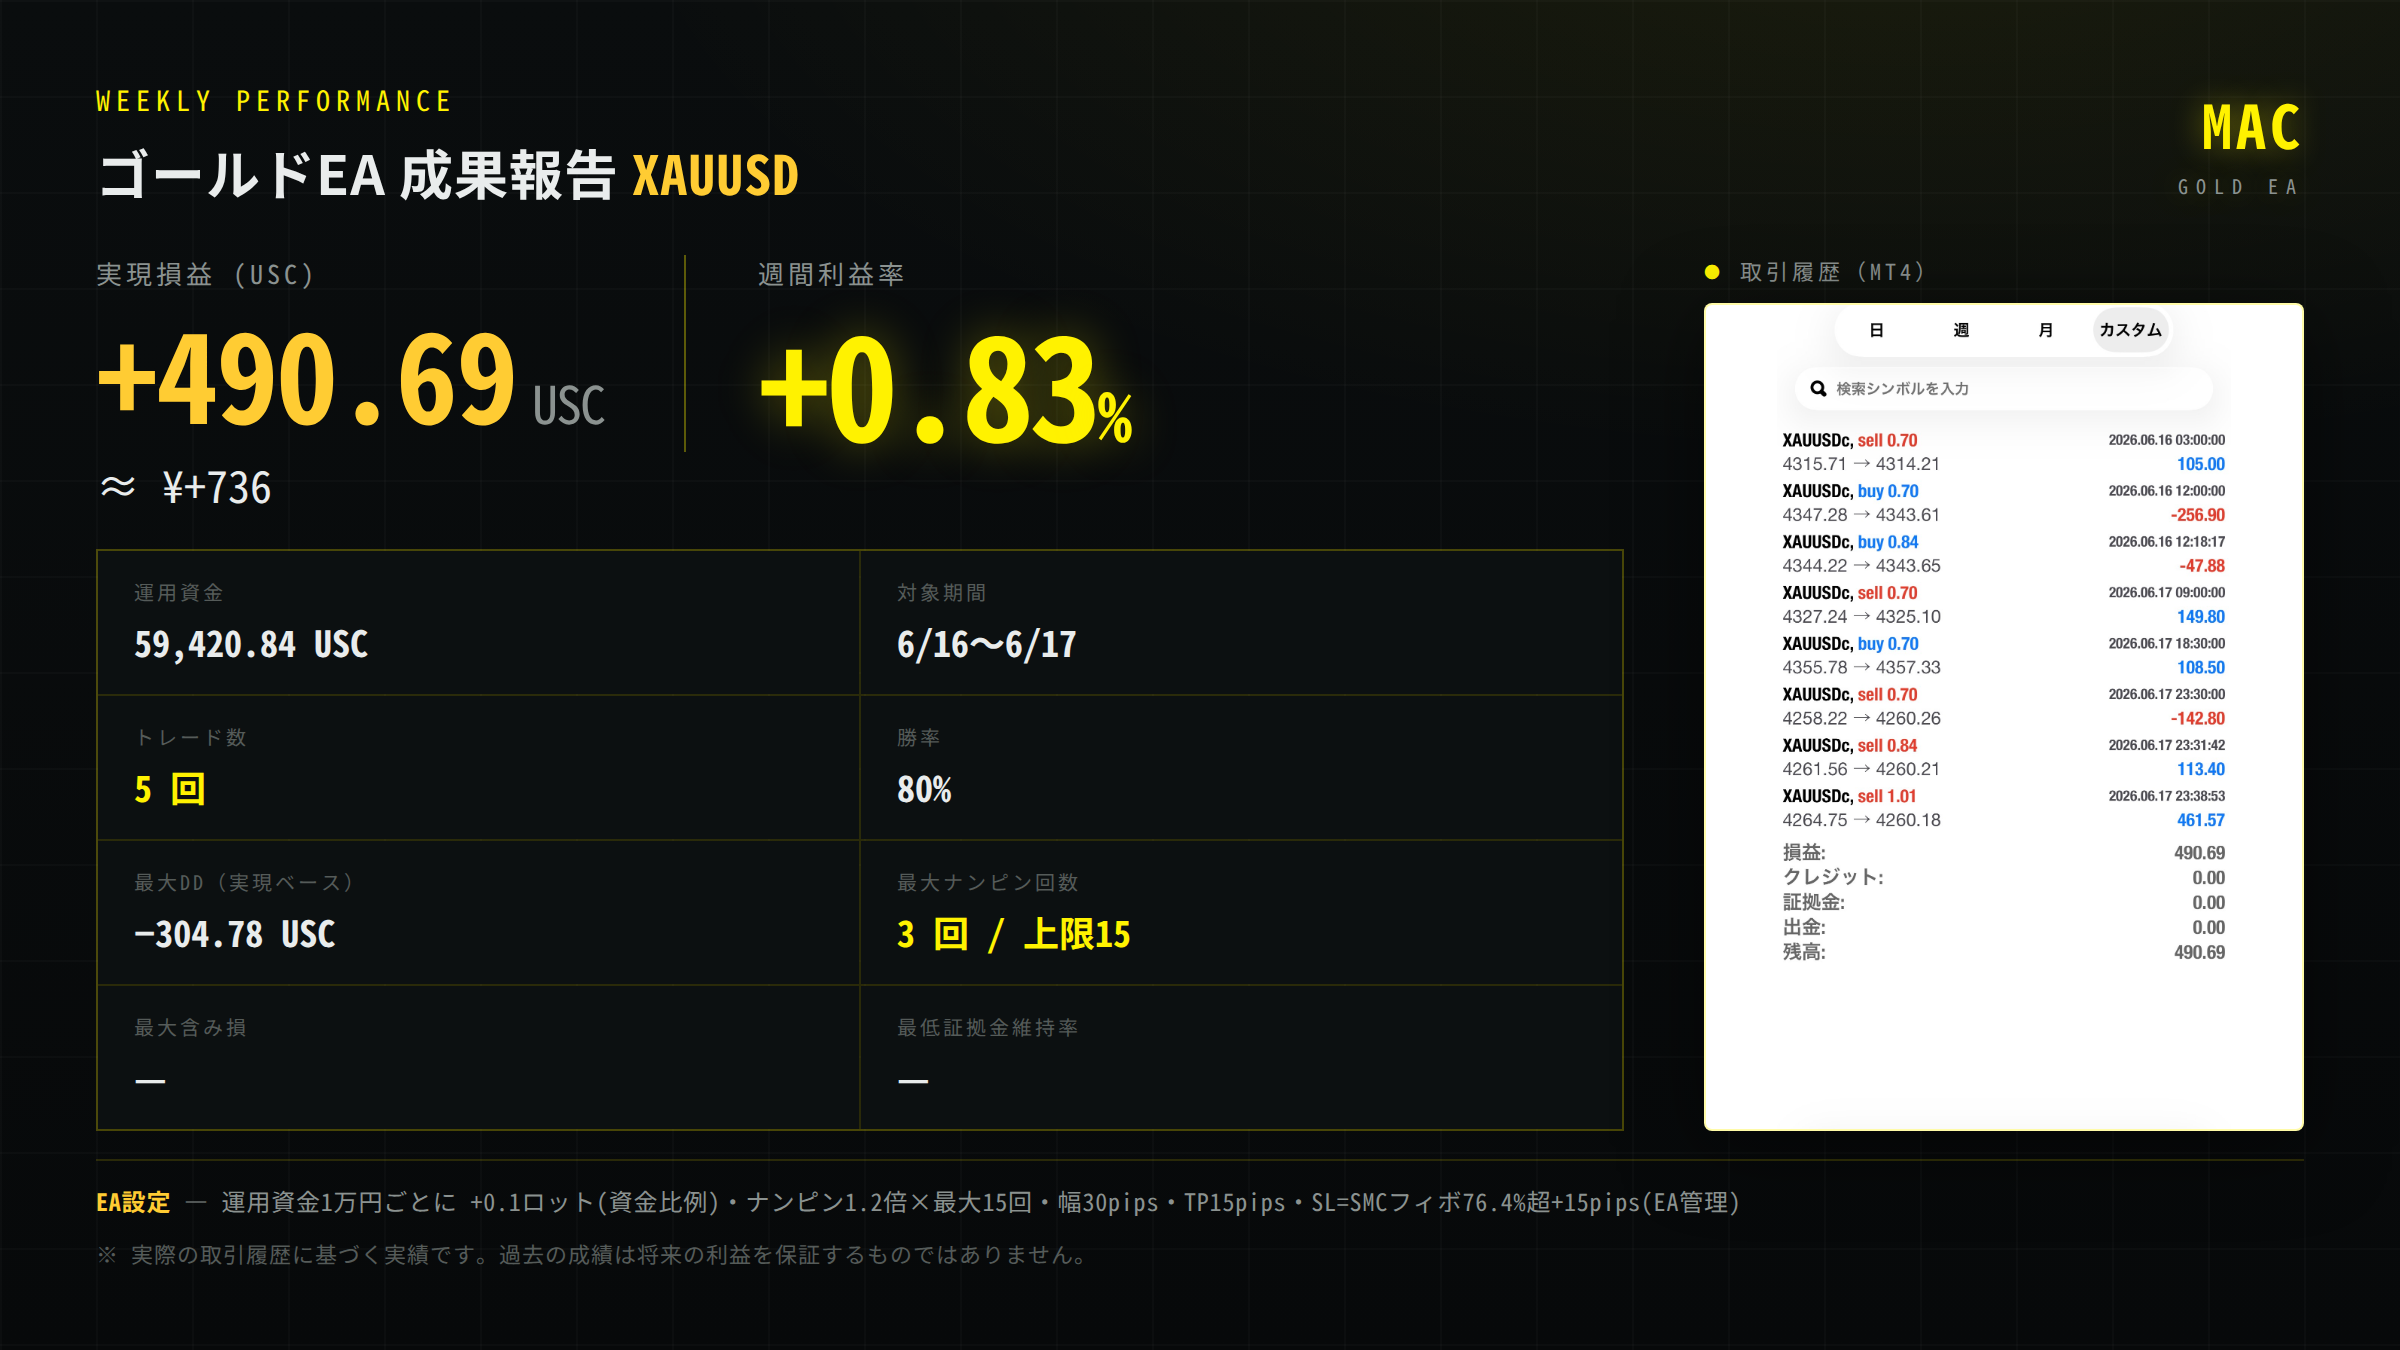
This is a verification log of MAC v2.0 results, lined up without deleting good or bad weeks. In addition to monthly and weekly numbers, we publish the maximum drawdown and maximum floating loss that we value (from the point we can measure them).
Monthly summary
| Month | Status | Max floating loss | Notes |
|---|---|---|---|
| May 2026 | Aggregating | Not yet measured | Aggregating from past screenshots |
| June 2026 | Running | Measuring from 2026-06-16 | — |
* Max floating loss shows real values from the week after the continuous logger was introduced on 2026-06-16. Before that there is no continuous record, so we honestly mark it “Not yet measured.”
Weekly log
| Week | Weekly P/L (USC) | Weekly return | Max floating loss | Result |
|---|---|---|---|---|
| 5/25-5/28 | +1,072.23 | +1.91% | Not measured | OK |
| 6/01-6/05 | +705.60 | +1.23% | Not measured | OK |
| 6/08-6/11 | +793.93 | +1.35% | Not measured | OK |
* If a losing week or month occurs, we add it to the same table without deleting it. That is the reason this page exists.
* The weekly/monthly dashboard images are added automatically over time in the Image Archive at the bottom of this page (losing months are never deleted).
* This page is not investment advice; it is analysis and verification information provided by our lab. FX/CFD trading may incur losses exceeding your principal. Past results do not guarantee future profits. Overseas brokers carry risks different from domestically registered brokers. Please make investment decisions at your own responsibility, within surplus funds.