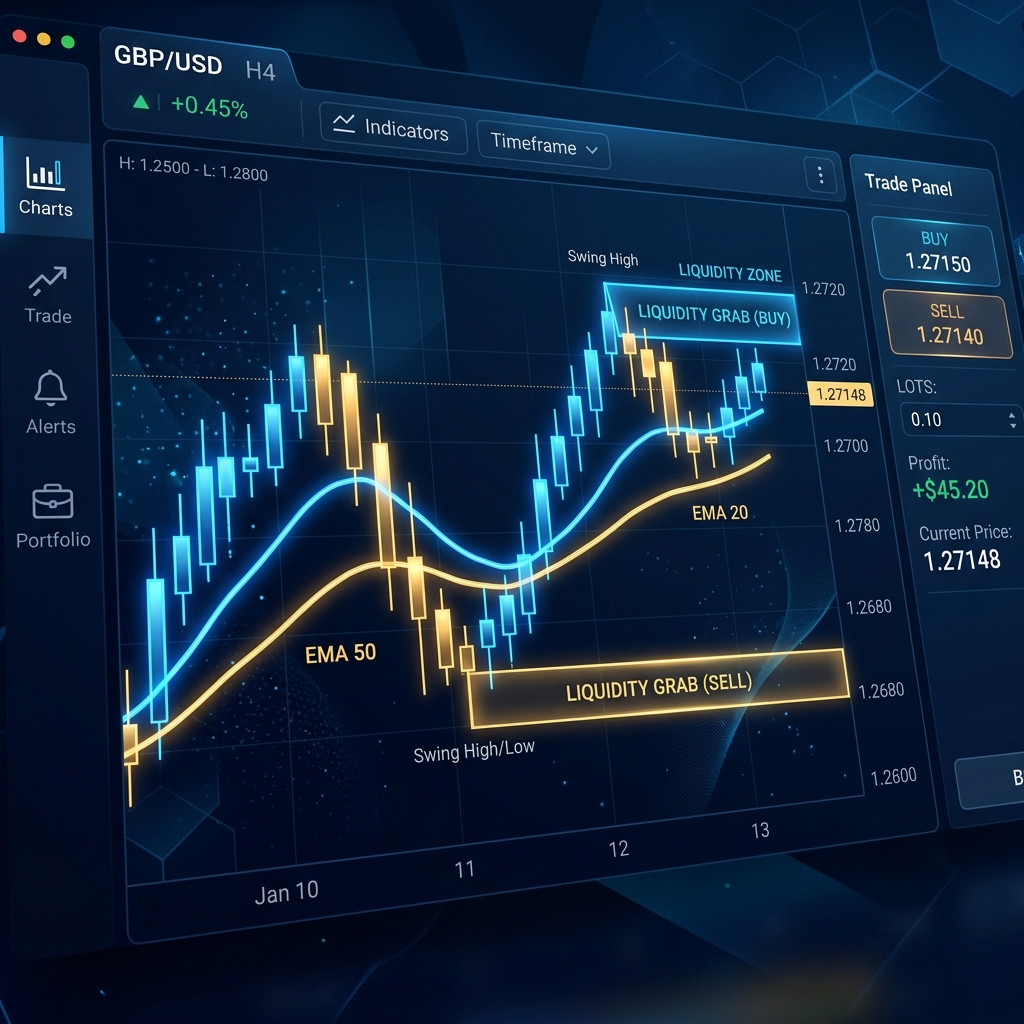
The core SMC principle of “sell at premium, buy at discount” sounds simple at first glance. However, if zone boundaries are set incorrectly, you risk holding a position in the opposite direction from institutional investors. This article covers the definition of premium and discount zones, how to calculate them, how to combine them with order blocks, and the recurring pitfalls that beginners fall into.
Definition and Mechanics
In Smart Money Concepts (SMC), the price range of any market can always be divided into two regions: an “overvalued area” and an “undervalued area.” The dividing line is the 50% midpoint of the range between the Swing High and Swing Low — known as the “Equilibrium.”
Price above the equilibrium is called the Premium Zone, and price below it is called the Discount Zone. The concept rests on the hypothesis that institutional investors accumulate sell orders in the premium zone and buy orders in the discount zone. It shares strong parallels with Wyckoff Theory’s “accumulation phase” and “distribution phase,” and SMC is sometimes regarded as a modern interpretation of those ideas.
Behind this zone framework lies the market dynamic in which institutional investors build positions gradually rather than flooding the market with large orders all at once. The idea is that in price ranges above the equilibrium, many buyers already hold open positions, creating an environment where institutions can more easily place sell orders. That said, this is a hypothetical model and does not apply universally to every market condition.
The key point is never to use this zone classification in isolation. If an uptrend is confirmed on the daily chart, an order block or Fair Value Gap (FVG) appearing inside the discount zone on the 1-hour chart becomes a valid entry candidate. Conversely, if the daily trend is bearish, look for sell candidates in the premium zone. Stepping outside of trend alignment significantly diminishes the reliability of the zones.
Practical Examples, Formulas, and Charts
The calculation is straightforward. Identify the Swing High (H) and Swing Low (L), then apply the following formula to find the equilibrium.
Equilibrium = L + (H – L) x 0.5
As an example, consider USD/JPY on the 4-hour chart with H = 152.000 and L = 148.000.
Equilibrium = 148.000 + (152.000 – 148.000) x 0.5 = 150.000
This gives a premium zone of 150.000-152.000 and a discount zone of 148.000-150.000.
| Zone | Price Range | Fibonacci Ratio | Institutional Behavior Tendency (Hypothesis) |
|---|---|---|---|
| Premium Zone | 150.000-152.000 | 50%-100% | Selling pressure tends to build |
| Equilibrium | 150.000 | 50% | Directional bias tends to be balanced |
| Discount Zone | 148.000-150.000 | 0%-50% | Buying pressure tends to build |
In practice, in addition to the 50% equilibrium level, traders also reference the 61.8% (golden ratio) and 70.5% levels. Areas where these coincide with order blocks or unfilled FVGs are frequently observed as institutional intervention points. Zone validity also shifts with trend strength and the current liquidity environment. In strong trend phases, pullbacks tend to be shallow, and price often reverses near the upper boundary of the discount zone. Before incorporating this approach into your own strategy, thorough backtesting is essential — including the use of quantitative metrics such as profit factor and expectancy.
Common Pitfalls for Beginners
- Mistaking zones for “guaranteed support or resistance that must hold.” Premium and discount zones are reference frames for narrowing down entry candidates — they do not guarantee a reversal. An entry should only be considered when additional confluence, such as an order block or FVG, overlaps within the zone. Entering based solely on the zone is equivalent to trading with only one piece of evidence.
- Letting the selection of swing highs and lows become subjective. The location of the equilibrium changes substantially depending on which swing you use as your reference. The principle is to start from higher time frames (weekly, daily) and prioritize swings that belong to the larger structure. If you cannot articulate why you chose a particular swing, the rationale behind your setup remains vague. It is also worth recognizing that different analysts looking at the same chart may draw entirely different zones.
- Entering in a zone that runs counter to the trend. Attempting a counter-trend short in the premium zone during an uptrend goes against the market structure. Straying from the basic framework of “uptrend x discount = buy candidate” and “downtrend x premium = sell candidate” significantly lowers your expected value.
- Failing to verify alignment across multiple time frames. Even if price is in the premium zone on the 4-hour chart, it may still be in the discount zone on the daily chart. Because higher time frame context overrides lower time frame judgments, multi-timeframe analysis cannot be skipped. When conclusions conflict between time frames, prioritize the higher time frame context.
FX AI Lab’s Perspective
Our lab is actively researching how to incorporate premium and discount zone logic into EA (Expert Advisor / automated trading) design — currently in the verification stage. In discretionary trading, defining swings is prone to subjectivity; our goal is to process those definitions consistently through algorithms, with an eye toward future use in copy trading, in order to improve the reproducibility of zone identification. With drawdown depth and martingale risk also in view, we are exploring designs that avoid excessive position additions. If you want to study SMC systematically, visit the Learning Library; if you want to test the methodology in a demo account, see the HFM Demo Account Opening Guide.
Related Links
This article is provided for informational purposes only and does not constitute a solicitation to invest in any specific financial product. FX trading involves exchange-rate risk, and losses may exceed the initial investment. Please be sure to review the Risk Disclosure before placing any trades.