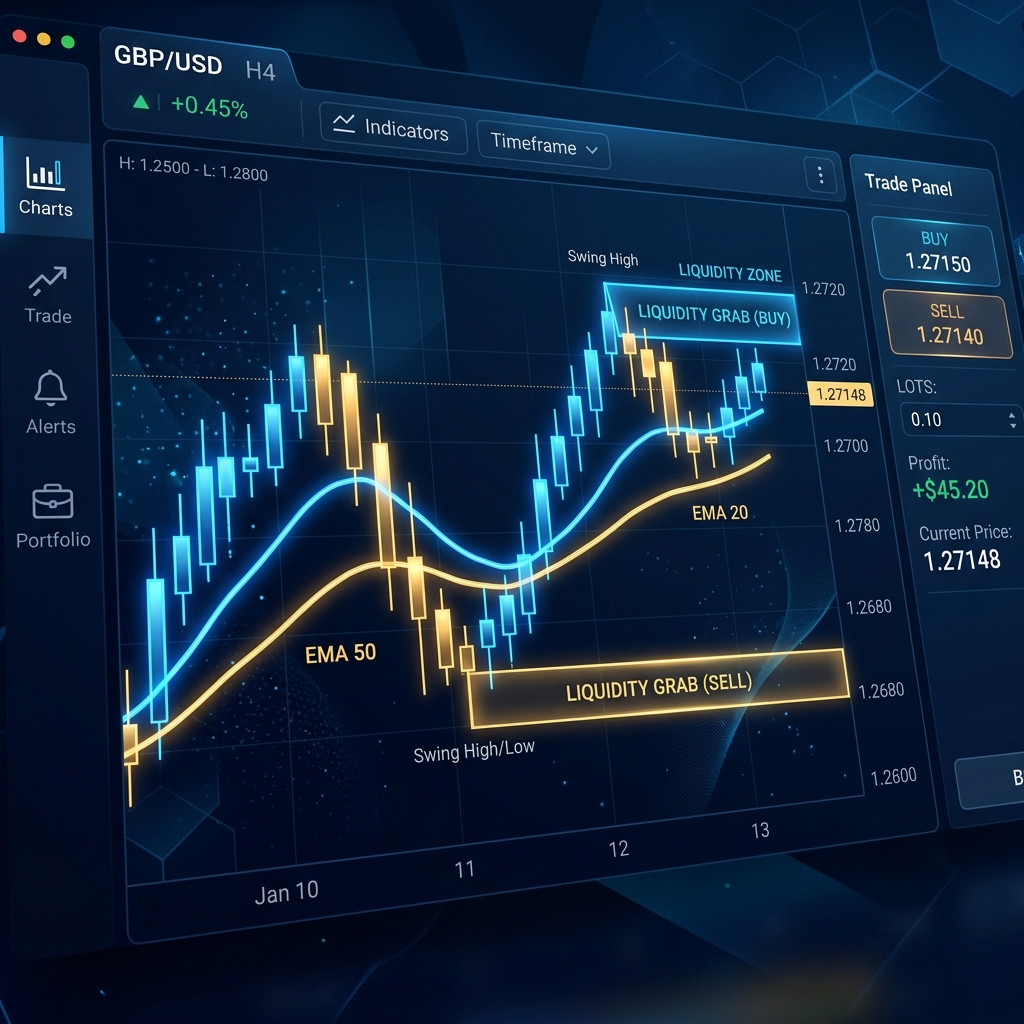
“Where does price reverse?” — This is one of the oldest questions in FX trading, and SMC (Smart Money Concepts) offers a structural answer: “price zones where institutional orders have accumulated.” The central concept behind that answer is the POI (Point of Interest). This article covers the definition of POI, its main types, the process for identifying them, and the pitfalls that practitioners often overlook.
What Is a POI (Point of Interest) and How Does It Work?
A POI (Point of Interest) is a price zone in SMC where institutional investors are presumed to have placed large orders. Whereas conventional support and resistance are defined as “horizontal levels that have reacted multiple times in the past,” a POI is defined on structural grounds as “the origin point of a specific price-action pattern” — a meaningful distinction.
The premise behind POI effectiveness is a market-structure hypothesis: when institutional players cannot fill their entire order in a single trade, price is drawn back to the origin zone to execute the remaining orders. This hypothesis is difficult to verify directly, but our lab is investigating it empirically by asking whether the price-reaction rate within POI zones is statistically different from that at other levels.
The main types of POI can be organized into the following three categories.
Order Block (OB)
The reference point is the last opposing candle that appears immediately before a strong impulse move (sharp rally or sharp drop). The last bearish candle before a sharp rally becomes a Bullish OB; the last bullish candle before a sharp drop becomes a Bearish OB. The high-to-low range of that candle is treated as the POI. Because this is considered the origin where institutions built their positions, orders are expected to re-activate when price returns to the zone.
Fair Value Gap (FVG)
When a sharp rally or drop occurs across three consecutive candles, the gap between the wick of the first candle and the wick of the third candle — with no overlap — forms a Fair Value Gap. In SMC this gap is treated as “unfilled liquidity,” with price expected to return and fill it later. The upper and lower boundaries of the FVG are observed for potential support and resistance respectively.
Breaker Block
A Breaker Block is an OB that previously held but was subsequently broken through by price, causing it to flip into a POI in the opposite direction. It is frequently used in combination with a Break of Structure (BOS) and is treated as a “re-entry zone after the original orders have been processed.”
Worked Example: How to Identify a Bullish OB and Set Your Criteria
Below is the step-by-step process for identifying a Bullish OB on an actual chart.
- Confirm a BOS (Break of Structure) or CHoCH (Change of Character) on a higher timeframe such as the 4H or Daily chart.
- Identify the origin of the “bullish impulse wave” that created the structural break.
- Mark the high-to-low range of the last bearish candle immediately before that origin point as the Bullish OB zone.
- When price returns to the POI, drop to a lower timeframe (15M to 1H) and look for an entry signal such as a lower-timeframe BOS flip.
| POI Type | Identification Basis | Usage Timing | Mitigation Threshold |
|---|---|---|---|
| Bullish OB | Last bearish candle before the rally (high-to-low) | Buy candidate on a pullback | Low fully broken to the downside |
| Bearish OB | Last bullish candle before the drop (high-to-low) | Sell candidate on a retracement | High fully broken to the upside |
| Bullish FVG | Gap in the three-candle rally (lower boundary to upper boundary) | Pullback confirmation on a return move | Gap fully filled |
| Bearish FVG | Gap in the three-candle drop (lower boundary to upper boundary) | Retracement confirmation on a return move | Gap fully filled |
| Breaker Block | Polarity-flipped zone of a broken OB | Re-entry zone after a structural shift | Broken through again in the opposite direction |
To improve the precision of OB zone entries, a common technique is to narrow entry timing to the 50% level (midpoint) of the zone. Entering across the entire zone makes spread and stop-loss management difficult, so waiting for price to reach the midpoint is an approach that optimizes the risk-reward ratio. For pre-evaluation metrics related to POIs, the EA Profit Factor (PF) Metrics Quick-Reference is also useful.
Common Pitfalls for Beginners
- Taking a POI trade while ignoring the higher-timeframe trend
A POI has no directional bias on its own. Buying into a Bullish OB on a lower timeframe while the higher timeframe is in a downtrend means trading against the dominant pressure. The correct sequence is to first establish your preferred direction through MTF (multi-timeframe) analysis, then filter POIs accordingly. - Labeling a subjective “zone that looks like it might reverse” as a POI
A POI is considered valid only when it strictly meets the condition of being an origin point following a BOS or CHoCH. Calling a gut-feel “this zone looks like it might bounce” a POI leads to non-repeatable trading. You need the habit of codifying your criteria and labeling charts based on rules. - Repeatedly trading a mitigated POI
When price fully passes through an OB or FVG zone, that POI is considered “mitigated” and its expected value drops significantly. It is essential to log whether price actually reacted when it reached the POI and to establish a rule against re-entering a mitigated zone. - Skipping position sizing and relying solely on the POI
Even when a POI works, neglecting to set a stop-loss and calculate position size for the case where price does not react can result in a large drawdown from a single losing trade. As discussed in Why Martingale-Style EAs Suffer Deep Drawdowns, risk management is a mandatory element that is independent of your entry rationale.
FX AI Lab Commentary
Our lab is quantitatively testing the SMC POI concept in an MT4 environment. At this stage we have observed that “in certain currency pairs and time windows, the reaction rate after price returns to an OB exceeds 50%,” but universal effectiveness across all markets and timeframes has not been confirmed. An EA that utilizes POIs is currently under development and testing; results will be published on the blog as they become available. The Learning Library also provides a systematic overview of related SMC concepts. We recommend first testing the POI approach on an actual chart using a risk-free HFM demo account.
Related Links
This article is provided for informational purposes only and does not constitute a recommendation to invest in any specific financial instrument. FX trading carries the risk of losses exceeding your initial investment. Before trading, please review our Risk Disclosure and proceed solely at your own judgment and responsibility.