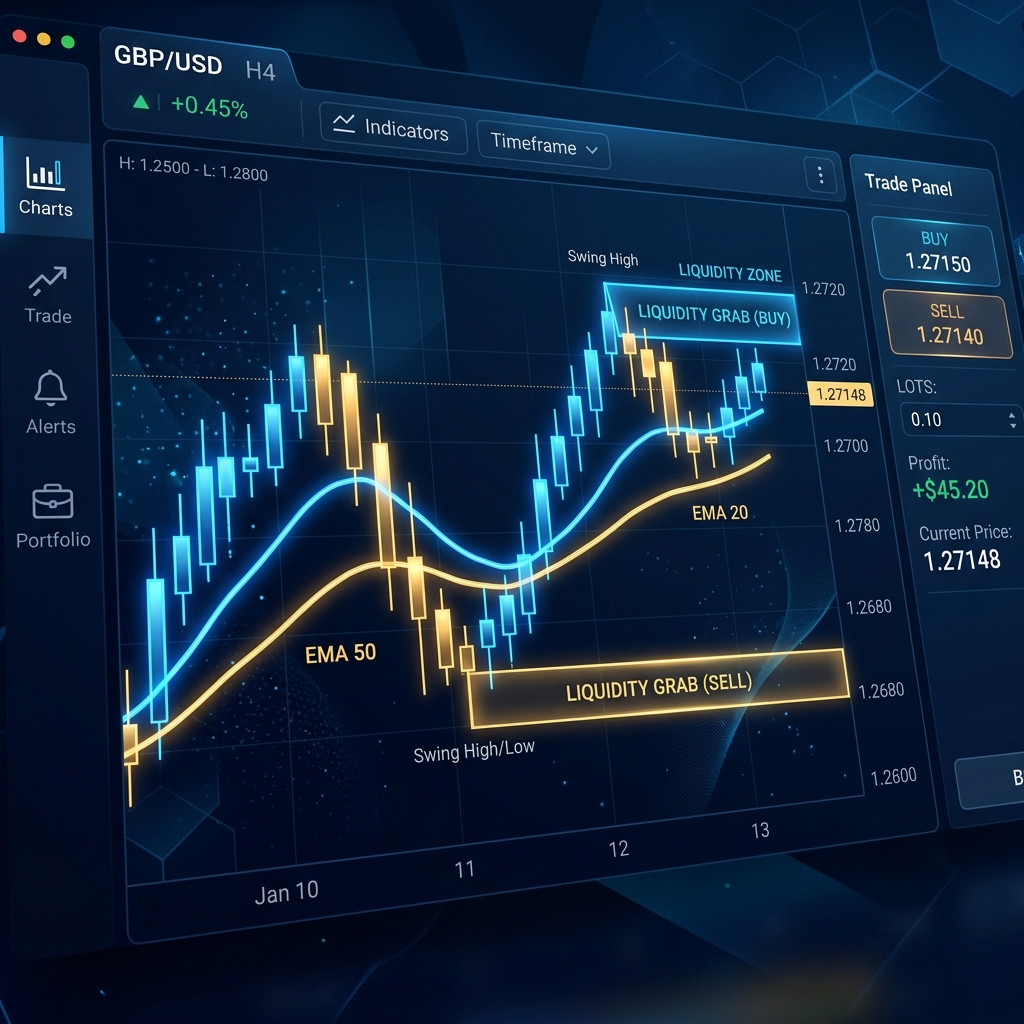
The order block — a core concept in Smart Money Concepts (SMC) — refers to a price zone where institutional orders are believed to have concentrated. However, using the term without a clear definition often leads to confusion with ordinary swing highs and swing lows. In this article, our institute organizes the definition of order blocks, the steps for identifying them, and key points to watch when testing them, drawing on concrete examples and data.
Definition / Mechanism
An order block refers to the “last opposing candlestick” formed just before price makes a significant move in one direction. The last bearish candle formed before a rally is a demand (buy) order block; the last bullish candle formed before a decline is a supply (sell) order block.
In the SMC framework, large orders cannot be filled all at once, so price is assumed to retrace to a specific zone to fill the remaining orders. That “zone with remaining orders” is the order block, and the hypothesis holds that price tends to react when it revisits it. It is important to understand that this is a concept inferred from price structure alone — it does not visualize actual order book data.
The prerequisite for an order block to carry meaning is that a clear structural break (BOS = Break of Structure) follows it. Only the candlestick that was the origin of a strong push through a recent high or low becomes a valid order block candidate for testing.
Concrete Example / Identification Steps
Using a demand order block as an example, here are the identification steps.
| Step | What to Check |
|---|---|
| 1. Find a structural break | Identify the point where price broke strongly above a recent high (a BOS occurred) |
| 2. Identify the origin candle | Designate the “last bearish candle” immediately before that rally as the order block |
| 3. Draw the zone | Draw the zone from the high to the low of that bearish candle (or from the open to the low) |
| 4. Wait for a revisit | Observe price reaction (lower wicks, reversal candles) when price returns to that zone |
As an example, suppose USD/JPY touches a high of 150.20, then rallies from a bearish candle near 150.00 all the way to 150.80. The bearish candle zone between 150.00 and 150.10 becomes a demand order block candidate. If price later returns to 150.10 and bounces with a long lower wick, the reaction matches the hypothesis. Conversely, if price closes its body below 150.00, the zone is judged to have failed.
What matters is that there is no number guaranteeing a win rate. How much price reacts on any given timeframe, currency pair, or market condition can only be understood after running your own backtests and forward tests. For guidance on the testing process, also refer to Benchmarks for PF (Profit Factor).
Common Pitfalls for Beginners
- Drawing lines in hindsight: Once a chart has closed, you can draw an “effective order block” anywhere. The real test is whether you can identify it in real time or verify it against historical data.
- Confusing order blocks with swing highs and lows: Calling every simple bounce an order block breaks down the concept. Distinguish them by whether a BOS (Break of Structure) immediately followed.
- Ignoring the higher-timeframe trend direction: Counter-trading based solely on a 5-minute demand block while the 4-hour chart is in a downtrend tends to produce only shallow reactions.
- Averaging down when the zone fails to hold: An order block is a “zone likely to react” — not a guarantee of reversal. The plan must include exiting if the zone is broken. The risks of averaging down are examined in detail in Why Averaging-Down EAs Have Deep Drawdowns.
- Increasing position size without verification: Increasing lot size immediately after learning the concept risks losing capital before edge has been verified. We recommend building a solid foundation first through the Learning Steps.
FX AI Lab’s Perspective
Our institute treats order blocks not as a “standalone profitable method” but as one factor for measuring edge when combined with liquidity and FVG (Fair Value Gaps). Verifying reproducibility is better suited to testing under consistent rules rather than human discretion, and our institute is currently advancing EA testing with SMC logic incorporated (currently in the development and testing phase — no confirmed track record yet). The testing process and methodology comparisons are being published progressively in the Research Library.
Related Links
This article is for educational and informational purposes only and does not constitute a recommendation of any specific trading method or trade. FX trading involves leverage, and losses may exceed deposited margin. All investment decisions are made at your own risk; please review each broker’s risk disclosure and this site’s disclaimer before trading.