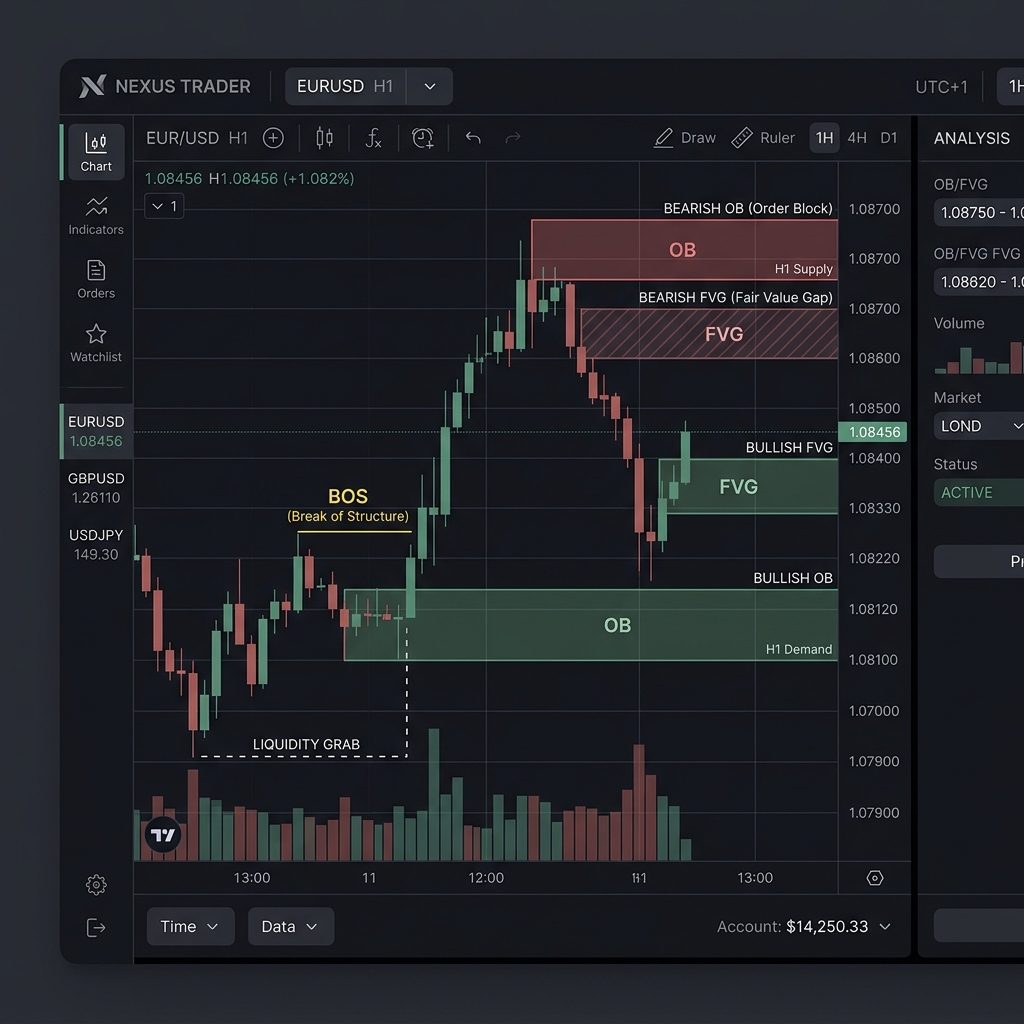
“You were watching the chart when the market suddenly reversed and hit your stop loss” — many traders have had this experience. In SMC (Smart Money Concepts), this type of reversal is structurally defined as a Market Structure Shift (MSS). This article systematically covers the definition, identification process, and practical considerations for MSS.
Definition / How It Works
In SMC, market structure refers to the pattern of how price highs and lows progress in sequence. In an uptrend, HH (Higher High: a new swing high) and HL (Higher Low: a rising low that holds above the previous low) repeat in sequence. In a downtrend, LH (Lower High: a pullback that fails to exceed the previous high) and LL (Lower Low: a new swing low) continue in sequence.
A Market Structure Shift (MSS) refers to the moment this pattern breaks down. During an uptrend, MSS occurs when price closes below the most recent HL. During a downtrend, MSS occurs when price closes above the most recent LH. MSS is a structural signal that flags a potential trend reversal candidate; it is not a standalone entry trigger.
SMC centers its analysis on the trading behavior of institutional participants. Large participants are said to sweep zones where stop-loss orders accumulate before reversing a trend, and MSS is viewed as one of the structural traces left behind by that reversal. That said, the occurrence of an MSS does not directly prove institutional activity; it is important to treat it strictly as a structurally observable fact.
A term often confused with MSS is ChoCH (Change of Character). Definitions vary across traders and educational resources, but in this article we distinguish them as: ChoCH = the first signal of structural disruption; MSS = the stage at which a structural reversal can be confirmed.
Examples / Summary of Identification Criteria
The table below summarizes MSS trigger conditions and their interpretation for both uptrends and downtrends.
| Scenario | MSS Trigger Condition | Interpretation |
|---|---|---|
| During an Uptrend | Price closes below the most recent HL (swing low) | Suggests bullish dominance is breaking down and sellers are taking control |
| During a Downtrend | Price closes above the most recent LH (swing high) | Suggests bearish dominance is breaking down and buyers are taking control |
As a concrete example, consider the EURUSD H4 chart. Starting from 1.2050, price rises through 1.2100 (HH) -> 1.2060 (HL) -> 1.2120 (HH). If price then closes below 1.2060, this breach of the HL is identified as an MSS. At that point, traders reassess their position bias and move into the phase of seeking entry opportunities on lower timeframes.
The typical action flow after an MSS is confirmed is as follows. First, switch to a lower timeframe (e.g., M15) and identify the order block (OB) formed by the preceding bearish impulse. Then wait for price to pull back into that OB, confirm the fill of a Fair Value Gap (FVG: an unfilled gap zone), and only then consider an entry.
Identification is generally done on a close basis rather than on wicks. If only a wick breaks below the HL, many traders disregard it as a potential fakeout and do not count it as an MSS. It is recommended to document your identification rules in advance and develop a habit of regularly reviewing your performance alongside trade metrics such as profit factor and expected value.
Common Pitfalls for Beginners
- Treating every HL/LH breach as an MSS. Within small price movements, HL and LH points form frequently. To identify a meaningful structural break, verify that the swing point represents a significant pullback or retracement relative to the recent move. Mechanically labeling every minor HL breach with no momentum as an MSS will increase the frequency of fakeouts.
- Ignoring higher-timeframe structure. Even if an MSS appears on M15, the H4 or D1 may still be in the middle of an uptrend. Entries that go against the higher-timeframe trend carry higher stop-loss risk; top-down analysis (confirming from higher to lower timeframes) is fundamental in SMC. The SMC Learning Series also provides a systematic guide to this top-down analysis process.
- Using MSS alone to trigger an entry. MSS is a structural signal that marks a potential trend reversal candidate. An actual entry requires confirming a combination of conditions, including OB, FVG, and liquidity levels. Entering based solely on MSS leads to an unstable win rate and tends to produce results with low reproducibility in backtesting.
- Confusing ChoCH with MSS and acting prematurely. Definitions vary by analyst, and some use ChoCH and MSS interchangeably. It is important to verify the definitions used in your chosen methodology or educational resource and standardize them within your own rule set. Cases of premature entries caused by definitional inconsistency are not uncommon.
FX AI Lab’s Perspective
At our lab, we treat MSS not as an independent entry signal but as a state variable within market structure. In the EA logic currently under development, MSS is incorporated as one of the filter conditions, and we are testing entry precision under combined conditions with OB and FVG. We have no publishable performance data at this time, but we intend to continuously disclose the progress of our demo account testing on the Glossary and Method Library and blog. For those who want to explore SMC methods without risking real capital, we recommend opening an HFM demo account.
Related Links
This article is intended for informational purposes only and does not constitute a recommendation of any specific investment action. Foreign exchange trading involves a high level of risk, including the potential loss of principal. All investment decisions are made at your own risk. Please refer to our Risk Disclosure for details.