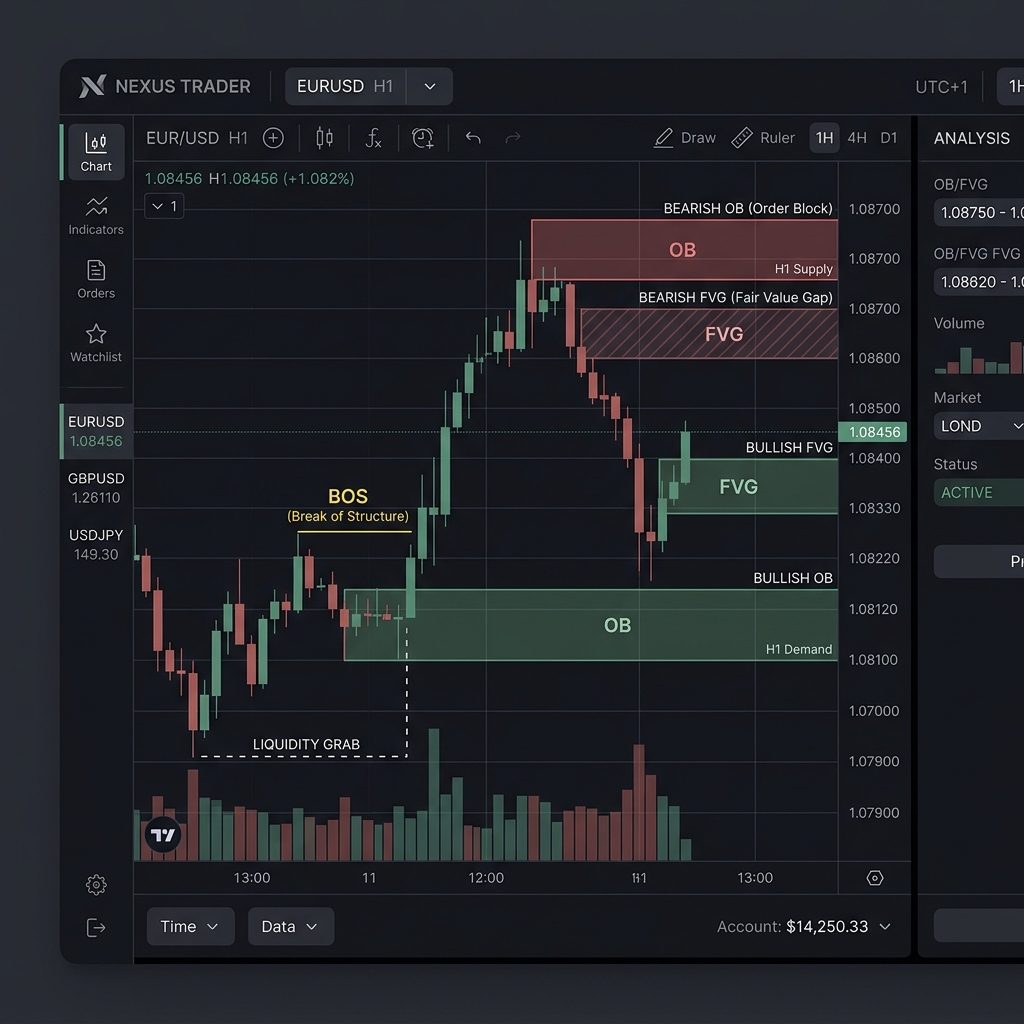
If you find yourself staring at charts and thinking “I have no idea where price will reverse,” you may be missing the perspective needed to read the underlying skeleton of price. SMC (Smart Money Concepts) market structure is a framework for systematically determining trend continuation and reversal from the sequential patterns of highs and lows. This article walks through the definition, a step-by-step reading method, and the mistakes beginners most commonly make.
Definition and Mechanics of Market Structure
Market structure is the systematic organization of the continuity of swing highs and swing lows that price forms. In SMC, the first step is to distinguish four types of swing points.
HH (Higher High) is a new high that surpasses the previous high; HL (Higher Low) is a pullback low that stays above the previous low. An uptrend is defined as a state in which HH and HL alternate in succession. Conversely, LH (Lower High) is a rally high that fails to reach the previous high, and LL (Lower Low) is a new low that breaks below the previous low — a continuous sequence of LH and LL defines a downtrend.
SMC adds two structural signals to this framework. BOS (Break of Structure) is the signal for trend continuation: in a rising market it is confirmed when a candle closes above the most recent HH, and in a falling market when a candle closes below the most recent LL. CHoCH (Change of Character), on the other hand, is the early signal for a trend reversal — a move that breaks below the most recent HL during an uptrend, or breaks above the most recent LH during a downtrend. It is important to note that CHoCH only indicates the “possibility of a reversal” and is not sufficient on its own as a basis for entering a trade.
The criteria used to define valid swing points also matter. Most SMC traders require that “at least two candles with a lower high and a higher low flank both sides of the target high or low.” Without this standard, minor noise ends up being misidentified as structure.
Reading Market Structure Through a Concrete Example
Using a USD/JPY daily chart as an example, the following schematizes the flow from an uptrend through the occurrence of a CHoCH (all prices below are hypothetical values for illustration purposes only).
| Reference Day (Example) | Price (Example) | Swing Point | Structural Signal |
|---|---|---|---|
| Day 1 | 147.50 | HL (Pullback Low) | — |
| Day 3 | 149.20 | HH (New High) | BOS Confirmed |
| Day 6 | 148.40 | HL (Pullback Low) | — |
| Day 9 | 150.80 | HH (New High) | BOS Confirmed |
| Day 12 | 148.10 | LL (Breaks Day 6 HL) | CHoCH Triggered |
When a CHoCH occurs on Day 12, the trader puts the bullish scenario on hold and enters a process of re-examining the higher timeframe structure and nearby order zones (order blocks). Rather than immediately entering in the opposite direction after a CHoCH, the standard procedure is to wait for a fresh BOS to form on a lower timeframe.
Timeframe selection is directly tied to analytical precision. The most common practical approach is a multi-timeframe method: use the daily and 4-hour charts to grasp the broad structural picture, then narrow down entry candidates on the 1-hour and 15-minute charts. The principle of only considering an entry when the higher timeframe direction and the lower timeframe structural signal align applies not just to SMC but to price action analysis in general. Our learning page organizes each SMC concept systematically — please refer to it alongside this article.
Pitfalls Beginners Commonly Fall Into
- Confusing BOS with CHoCH: It is common to look only at the fact that “price exceeded a high” or “price broke a low” without being able to distinguish whether that constitutes a BOS or a CHoCH. What matters is which swing point is being used as the reference. We recommend building the habit of drawing out the correspondence on paper — breaking above the most recent HH during an uptrend is a BOS, while breaking below the most recent HL is a CHoCH.
- Mistaking IDM (Inducement) for a genuine break: In SMC, a “false break” known as IDM (Inducement) can occur. For example, in a situation where stop orders are clustered near an HL, price may temporarily dip below the HL and immediately recover. If this is interpreted as a CHoCH and a short entry is taken, the subsequent continuation of the uptrend results in a loss. Methods exist for judging IDM based on whether the move is a body close or a wick, but it is important to acknowledge that this can only be confirmed after the fact.
- Entering based solely on lower timeframe structure: On the 1-minute and 5-minute charts, BOS and CHoCH signals appear in rapid succession, making it easy to act on signals that run counter to the higher timeframe direction. Thoroughly following the procedure of confirming the trend direction on the daily and 4-hour charts before analyzing lower timeframes allows you to avoid unnecessary counter-trend trades.
- Changing the definition of swing points depending on the situation: The standard for defining valid swing points — specifically, how many candles must flank the point — varies across educational materials and indicators. When the definition shifts from chart to chart, the same market can produce different conclusions, making judgments unstable. Setting an explicit rule that can be backtested in advance, and then validating it with that same definition over a fixed period, is essential. The quantitative metrics our lab references when evaluating EAs are explained in detail in Metrics to Look at in EA Verification.
FX AI Lab Perspective
Our lab is advancing verification work on incorporating market structure as a filtering condition within EAs (automated trading systems). Logic that waits for a pullback to an order block after BOS confirmation has shown a degree of edge in backtesting, but due to the risk of parameter over-optimization, it is currently positioned as being in the “verification stage.” We are not yet at a point where we can publish confirmed results, and we continue to evaluate it while accumulating operational data on demo accounts. If you are interested in designing a copy-trade system that applies SMC methodology, please reach out via our contact page.
Related Links
This article is provided for informational purposes only and does not constitute a solicitation to invest in any specific financial product. FX trading involves price fluctuation risk, and it is possible to lose some or all of your invested capital. All trading decisions are made at your own responsibility. Please review our Risk Disclosure for details.