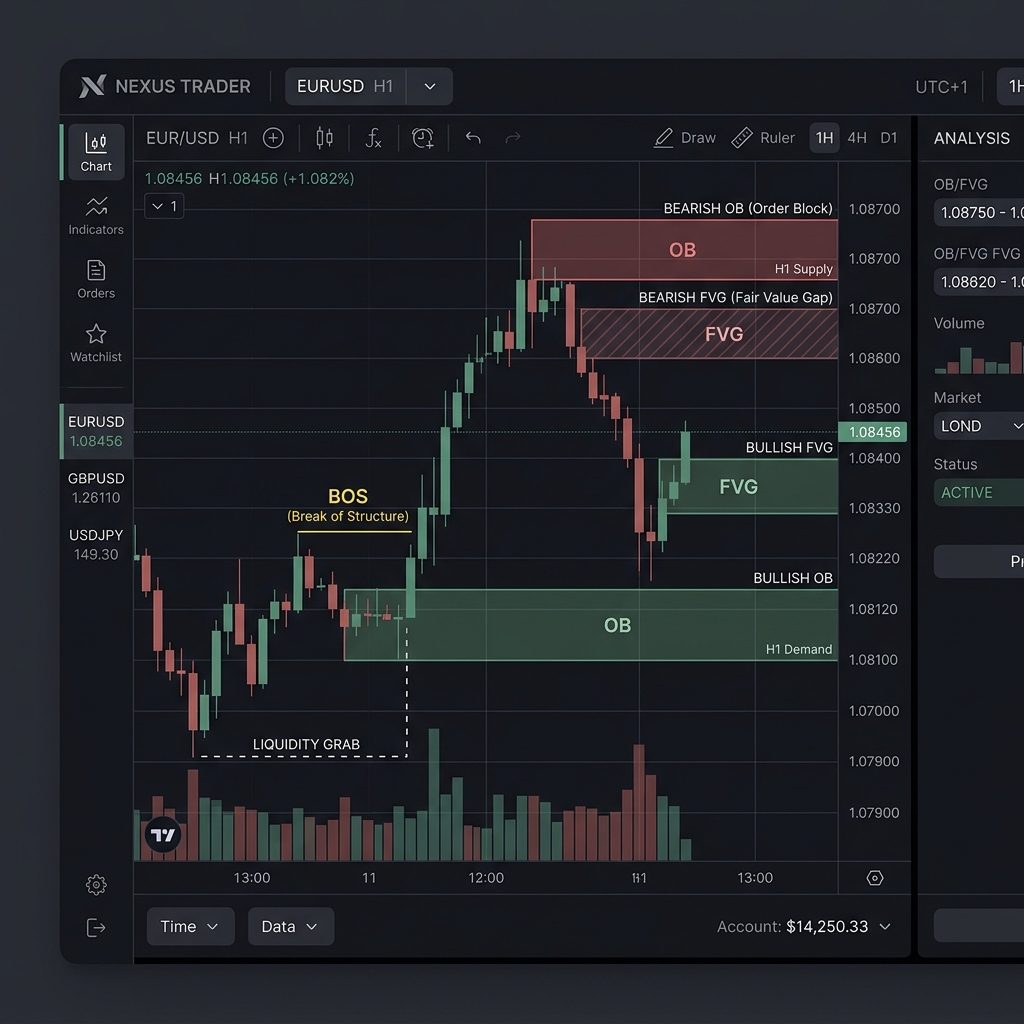
“My stop was hit and the market reversed immediately” — this is something many traders have experienced, and it is no coincidence. It can be explained by the dynamics of liquidity as defined in SMC (Smart Money Concepts). This article covers the definition of liquidity, how to identify where orders accumulate, and common misconceptions among beginners, drawing on verification data from our lab.
What Is Liquidity? Definition and Mechanics
Liquidity refers to clusters of pending orders concentrated at a specific price level. In SMC, large institutional capital (smart money) is understood to intentionally target these order clusters in order to fill their own large positions — because executing a large-lot trade requires sufficient counterpart orders on the opposite side to match against.
Liquidity falls into two main categories. Buy orders and stop-losses that accumulate above recent highs are called BSL (Buy Side Liquidity), while sell orders and stop-losses that pool below recent lows are called SSL (Sell Side Liquidity). When price temporarily breaches these levels to trigger those orders and then reverses, the move is known as a “liquidity sweep” — what traders commonly call a stop hunt.
Orders tend to concentrate especially around Equal Highs and Equal Lows — price levels where the market has reached nearly the same price more than once. The more obvious a level appears on a chart, the more traders will place their stop-losses there, and the deeper the liquidity pool becomes.
Practical Examples and Types of Liquidity
Imagine Gold (XAUUSD) has formed two Equal Highs at $2,350. Many traders place their stop-losses just above that level — around $2,352 — for both long stop-losses and breakout buy entries. Price pushes up to $2,353, triggers all those orders, then drops sharply back to $2,340. That is a BSL sweep. Buyers who chased what appeared to be a breakout find themselves caught at the worst possible price.
| Type | Location | Orders That Accumulate | Typical Move After Being Targeted |
|---|---|---|---|
| BSL (Buy Side Liquidity) | Above recent highs and Equal Highs | Buy stop-losses / short stop-losses | Reversal to the downside after the sweep |
| SSL (Sell Side Liquidity) | Below recent lows and Equal Lows | Sell stop-losses / long stop-losses | Reversal to the upside after the sweep |
| Internal Liquidity | Minor highs and lows within a range | Short-term trader orders | Consumed on the way toward external liquidity |
| External Liquidity | Prominent major highs and lows | Heavy concentration of stop-losses | Often becomes a major turning point in the market |
The reading process is straightforward. (1) Identify the most recent clear highs and lows, along with any Equal Highs and Equal Lows. (2) When price breaks a level, judge whether it is a “continuation breakout” or a “sweep and reversal” by watching how quickly price reclaims the level. (3) Only when you can identify a sweep do you then evaluate the directional edge for the reversal.
Common Pitfalls for Beginners
- Assuming “breakout = continuation”: When Equal Highs or Equal Lows are taken out, it frequently ends as a liquidity sweep rather than a true breakout continuation. In our lab’s visual backtesting of Gold on the 1-hour chart, a meaningful share of clear Equal High breakouts returned below the level within the same trading day. Strategies that chase every breakout unconditionally are poorly suited to this dynamic.
- Placing stops at the obvious location: Just beyond the most recent high or low is where most traders think alike — meaning liquidity is thick there. The position everyone chooses is also, structurally, the position most likely to be hunted. The key mindset shift is to place your stop not where the chart ‘looks like’ it should go, but at the price where your trade thesis is invalidated.
- Using liquidity alone to determine direction: Liquidity only tells you where price is likely to be drawn — it does not by itself justify a trade direction. It only gains an edge when combined with order blocks, market structure shifts (BOS/CHoCH), and the directional bias of higher timeframes.
- Oversizing to recover a loss: Attempting to recoup a sweep loss immediately by averaging down or dramatically increasing lot size will rapidly accelerate drawdown. Understanding liquidity and managing risk are separate disciplines that must be treated independently.
FX AI Lab’s Perspective
Liquidity levels can be tracked visually, but monitoring Equal Highs and Equal Lows exhaustively across multiple currency pairs and timeframes is not practical for a human trader. Our lab is currently developing and testing EAs and copy-trade strategies that incorporate liquidity sweep detection logic. When they are complete and ready to publish, we plan to openly share the verification data and the thinking behind the logic on this site. For now, we recommend building a solid, systematic foundation in SMC basics and incorporating a liquidity perspective into your own trading approach.
Related Links
This article is intended for educational and informational purposes only and does not constitute a recommendation to buy or sell any specific instrument. FX and CFD trading carries the risk of losses that may exceed your initial investment. The logic and verification results described herein do not guarantee future profits. Please trade at your own judgment and responsibility, after carefully reviewing the risk disclosure documents of each broker.