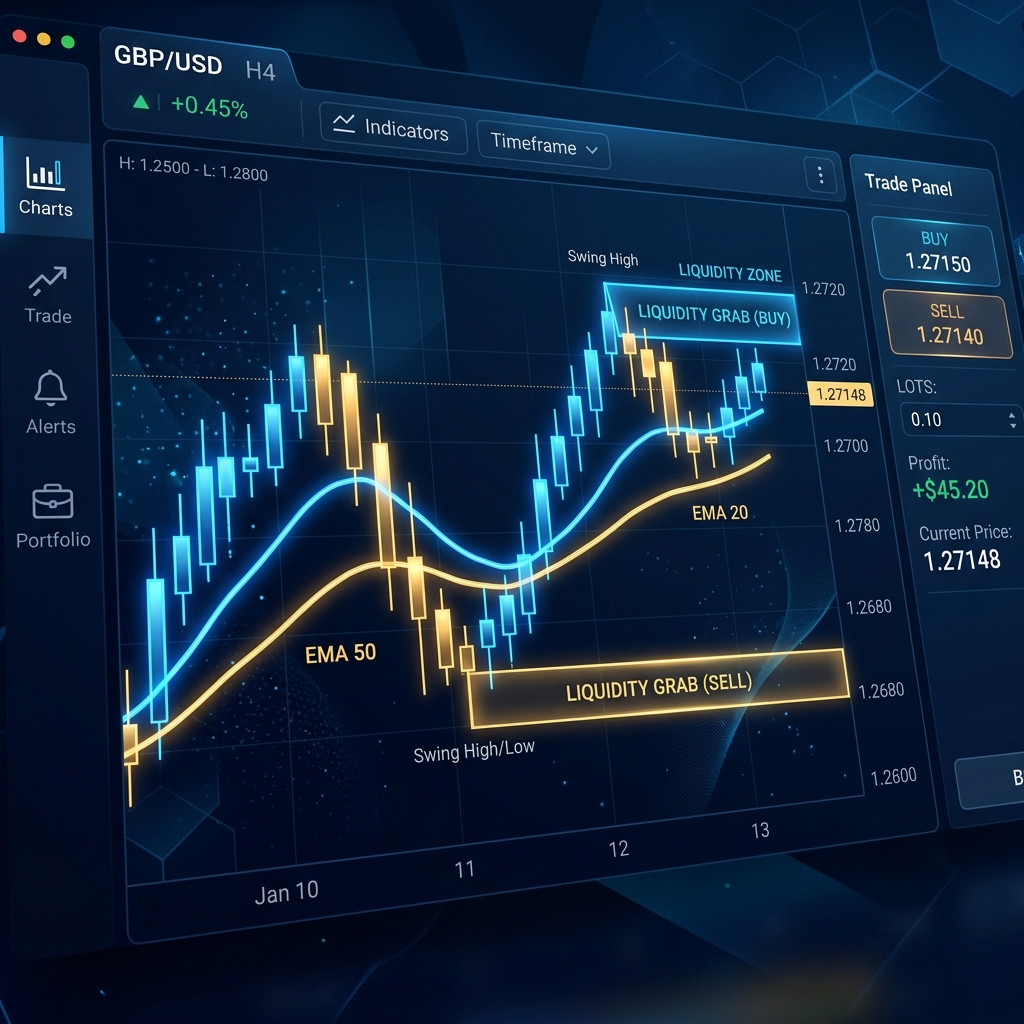
The “kill zones” discussed in SMC (Smart Money Concepts) refer to specific time windows during which institutional order flow tends to concentrate. However, entering trades based solely on these time windows can just as easily amplify losses. This article organizes the major kill zones — including London and New York — by session time (Japan Standard Time) and key characteristics, then explains how to combine them with structural analysis and what pitfalls beginners most commonly stumble into, from our lab’s perspective.
Definition / How It Works
Kill zones are a concept used in ICT (Inner Circle Trader)-based SMC theory, referring to defined time windows where liquidity concentrates and price tends to move. The underlying rationale is the empirical observation that volume surges when the three major sessions — Tokyo, London, and New York — overlap, making stop hunts (liquidity sweeps) and trend reversals more likely to occur.
The key point is that kill zones are not “times to enter” but “times to sharpen your observation.” Because liquidity sweeps — where price briefly breaks through a prior high or low (such as the previous day’s high or the edge of the Tokyo range) before reversing — are more prone to occurring during these windows, an edge only emerges when they are combined with structure (order blocks and break-of-structure signals). Session timing is merely one condition among several. For our lab’s foundational explanations, please also visit the FX Basics Learning Page.
Examples / Formulas / Charts
The major kill zones organized by Japan Standard Time (winter time) are shown below. Note that during Daylight Saving Time (DST), each window shifts approximately one hour earlier.
| Kill Zone | Session Time (JST, Winter) | Key Characteristics |
|---|---|---|
| Asia (Tokyo) | 09:00–12:00 | Primarily range-bound. Highs and lows that later serve as sweep targets tend to form here. |
| London | 16:00–19:00 | Volatility expands sharply. Sweeps of the Tokyo range extremes occur frequently. |
| New York | 21:00–24:00 | Maximum liquidity during the London-New York overlap. Economic data releases are concentrated here. |
| London Close | 00:00–02:00 (next day) | Reversals driven by profit-taking tend to emerge. |
For example, suppose the Tokyo session forms a range between 150.20 and 150.50. During the London session, price temporarily pushes up to 150.55, triggering buy stops, then reverses back to 150.30 — this is a textbook liquidity sweep. The moment that reversal breaks below the most recent structure is the bearish rationale SMC traders prioritize. Conversely, if you only watch the session clock and jump in on the 150.55 breakout, you risk getting caught in the reversal.
Common Pitfalls for Beginners
- Entering on session time alone: Kill zones are “times when movement is likely,” not “times when winning is guaranteed.” Entries without structural confirmation tend to become low-edge counter-trend trades.
- Not accounting for DST offsets: When the US and Europe switch to daylight saving time, session windows shift by roughly one hour. Relying on winter-time references means you end up watching the most active overlap an hour off.
- Ignoring overlapping economic releases: The New York session coincides with events such as US Non-Farm Payrolls and CPI. Spread widening and instant slippage are common, which is a key reason why backtest data can diverge from live trading results.
- Trying to trade every kill zone: Staying glued to all three or four sessions per day leads to overtrading. Excessive entries without proper money management tend to compound losses in a way that mirrors averaging-down or martingale-style drawdowns. For more, see Why Averaging-Down EA Drawdowns Get So Deep.
Our Lab’s View
Our lab believes kill zones are useful as a time filter, but lack sufficient reproducibility on their own. We are currently developing and testing EA logic that combines session-time filtering with structural assessment, running backtests restricted to specific kill zones alongside forward testing in parallel. We plan to publish this as work-in-progress data rather than confirmed results. Our approach to verification methodology is also covered in Gold EA Verification Metrics. We will report progress together with our copy-trade-linked operational policy as it develops.
Related Links
This article is provided for informational purposes only and does not constitute a solicitation to engage in any specific trade or to purchase any financial product. Margin trading, including FX, carries the risk of losses exceeding your initial investment. The session times, indicators, and verification content presented here do not guarantee future results. All trading decisions are made at your own risk; please ensure you fully understand the risks involved before trading.