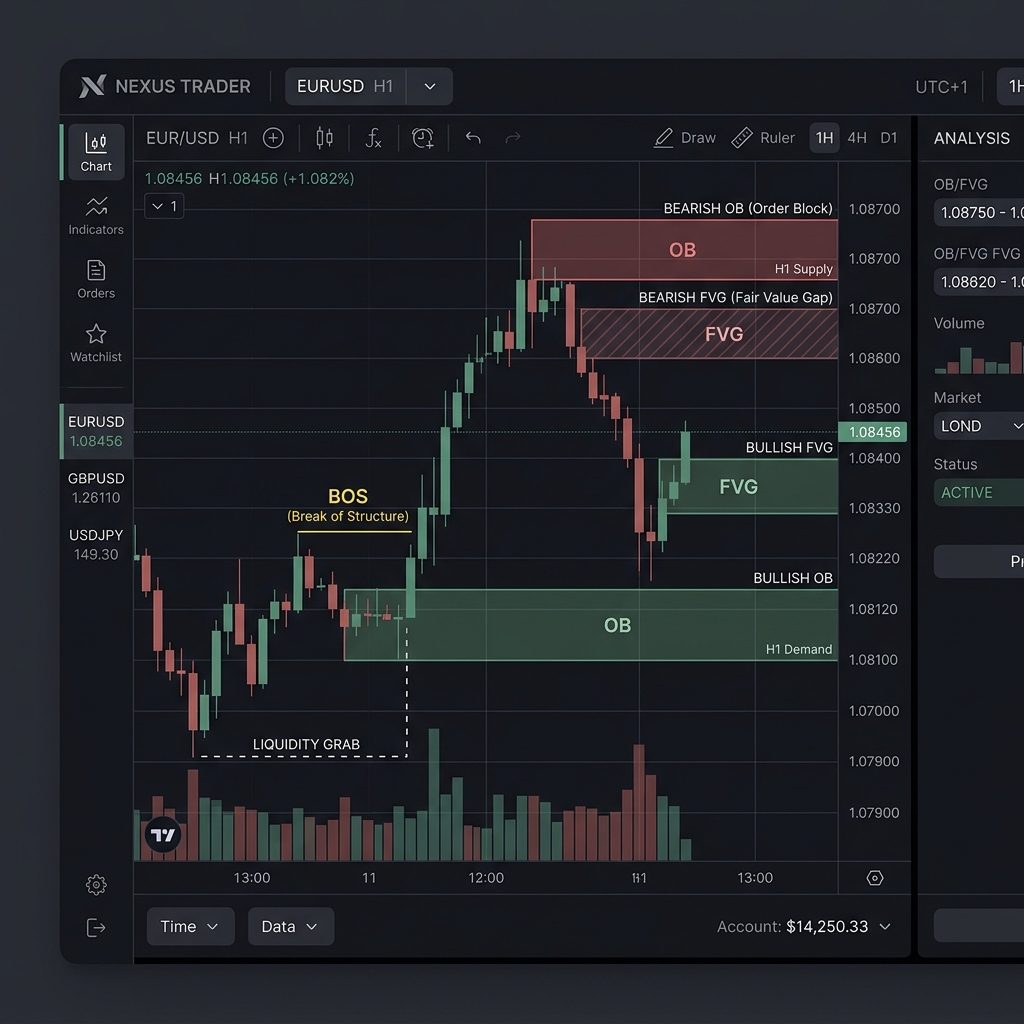
You enter what looks like a clear breakout, price immediately reverses, you get stopped out, and then it charges off in the direction you originally expected. In SMC (Smart Money Concepts), most of these moves can be explained by inducement (IDM). This article defines what SMC inducement is, explains the mechanics behind how decoy liquidity gets hunted, walks through a USD/JPY numerical example, and covers common misapplications that beginners fall into — all with a data-driven approach.
Definition / Mechanism
Inducement (IDM) refers to the decoy liquidity that institutional players (smart money) deliberately create just ahead of their true entry zone — the POI (Point of Interest) — before driving price there. Liquidity refers to price zones where stop losses and limit orders are clustered. In SMC, the sell-side liquidity accumulated below swing lows where buyers’ stops are concentrated is called sell-side liquidity (SSL), while the buy-side liquidity accumulated above swing highs where sellers’ stops are concentrated is called buy-side liquidity (BSL).
Inducement manifests as a recently prominent swing high or low. Most traders treat these levels as support/resistance or as the origin of a breakout, and place their entries and stops there. Smart money first pushes through this obvious high or low (the IDM) to fill the clustered orders and collect liquidity, then reverses price at its true target — the order block (OB).
In practice, the standard sequence is: wait for a CHoCH (Change of Character) or BOS (Break of Structure) that signals a structural shift, then enter only after the IDM has been swept and price has reached and reacted at the true POI. Observing the IDM sweep and the POI reaction as a pair is what distinguishes this approach from simple breakout trading. The foundational SMC structural terms (BOS/CHoCH) are covered on the SMC learning page.
Concrete Example / Formula / Chart
Take a USD/JPY uptrend as an example. Assume the higher timeframe is bullish and there is a bullish order block acting as the primary pullback-buy target near 154.60. On the way down to that OB, a prominent recent swing low (IDM) forms at 154.70. Many participants interpret a break of 154.70 as continuation downside and either sell or place their long stop losses just below it.
What typically happens is that price dips just 7 pips to 154.63, sweeps those stop losses (collecting sell-side liquidity), then reverses from the OB at 154.60. The table below maps out this sequence.
| Phase | Price (JPY) | Range from Prior | Observation Point |
|---|---|---|---|
| ① IDM Formation | 154.70 | — | Prominent recent swing low mid-pullback. Buy stop losses concentrated here |
| ② IDM Sweep | 154.63 | −7 pips | Breaks below the low, collecting SSL (sell-side liquidity). Also triggers early short entries |
| ③ POI Reached | 154.60 | −3 pips | Price arrives at the primary bullish OB |
| ④ Reversal | 155.10 | +50 pips | Rally from the OB. Traders stopped out at ② are forced to cover (short squeeze) |
If you wait for a reaction at the OB (step ③) before buying, placing your stop outside the swept liquidity (e.g., 154.45, roughly 15 pips) and targeting 155.10 (roughly 50 pips) gives a risk-reward ratio of approximately 3.3:1. The key point is that jumping in at step ① or ② — before the IDM is swept — puts you on the hunted side. Whether you define the IDM sweep by a closing price or a wick also affects outcomes, so having a documented rule is essential.
Common Pitfalls for Beginners
IDM is a simple concept, but it is easy to misapply when putting it into practice. The most frequent stumbling blocks we see in our research are as follows.
- Misidentifying every swing high and low as an IDM: IDM only carries meaning in relation to the nearby POI. Labeling every random recent high or low as IDM without context will undermine your entry rationale.
- Jumping in before the IDM is swept: Entering the moment price appears to break out puts you on the hunted side. The prerequisite is waiting for SSL/BSL collection and then confirming a reaction at the POI.
- Ignoring the higher-timeframe bias: Judging by a lower-timeframe IDM alone often means trading counter-trend against the higher-timeframe flow. Always establish the higher-timeframe (HTF) direction first, then look at the lower timeframe.
- Placing your stop where it will be hunted: Just outside a recent swing high or low is where stop losses are most densely clustered and most easily swept. Your design must push the stop beyond the liquidity zone. The way stop placement affects your edge is closely related to the concepts covered in why martingale EAs accumulate deep drawdowns.
- Assuming the IDM will always be swept: There are cases where price bypasses the IDM entirely. Do not treat this as a fixed rule — verify the frequency through backtesting.
FX AI Lab’s View
Our lab prioritizes converting inducement from a discretionary feel into verifiable, documented rules. We define IDM (as the most recent prominent swing high or low), specify how to judge the sweep (closing price or wick), and set the conditions for confirming a POI reaction — then measure frequency and statistical edge against historical data. Our proprietary EAs and copy-trade logic currently in development and testing also apply this framework to IDM-based entries. For guidance on designing EA evaluation metrics, see our articles on profit factor benchmarks and the verification library.
Related Links
This article is for educational and informational purposes only and does not constitute a recommendation to trade any specific method or financial instrument. Forex and CFD trading involves leverage and may result in losses exceeding your deposited margin. All investment decisions are your sole responsibility. Please read the risk disclosures and pre-contract documents provided by each broker before trading.