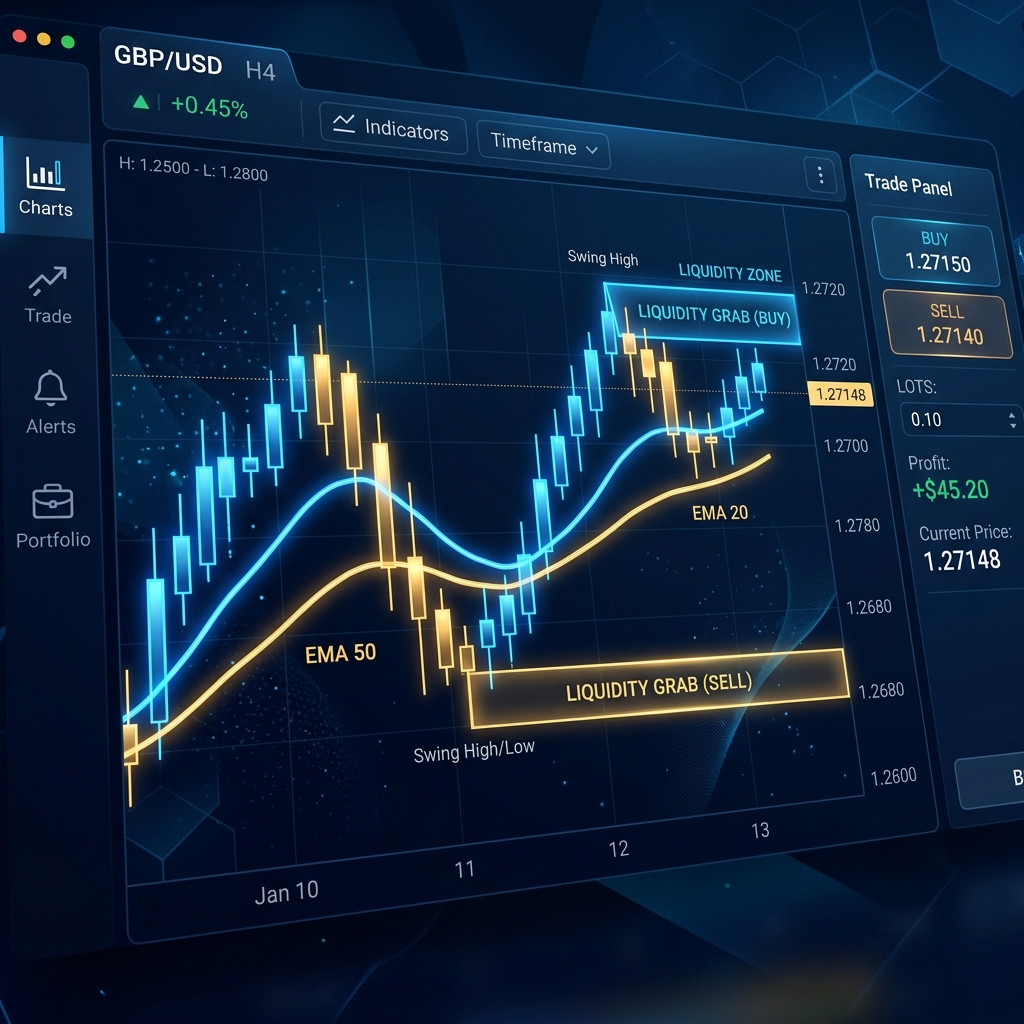
When reading charts, you will often notice highs that stall at the same price level two or three times, or lows that repeatedly bounce from the same zone. In SMC (Smart Money Concept), these are called “Equal High (EQH)” and “Equal Low (EQL)” — viewed not as mere consolidation, but as deliberate target zones where institutional traders come to collect liquidity. This article walks through their definitions, mechanics, real-world examples, and common misconceptions.
Definition and Mechanics
In SMC, an Equal High (Equal High / EQH) refers to a condition where two or more swing highs line up at virtually the same price level on the chart. Symmetrically, an Equal Low (Equal Low / EQL) is a pattern where two or more swing lows cluster at the same price level.
The reason this matters is that many retail traders, when a level repeatedly acts as resistance or support, place their stop-loss orders just outside that level. Above an EQH, buy-position stops (sell orders) accumulate; below an EQL, sell-position stops (buy orders) pile up. From the SMC perspective, these clusters of stop orders are “liquidity” — the fuel institutional traders need to find counterparties when executing large orders.
For institutional traders to build large positions, a matching volume of opposing orders must exist in the market. When stop-losses around an EQH are triggered in a cascade, the counterpart buy orders for the institution’s short positions are suddenly supplied to the market. SMC calls this process a “Liquidity Sweep” or “Stop Hunt.” The pattern in which price reverses direction after the sweep has been widely studied as the “Sweep & Reverse” strategy.
The overall SMC framework is covered in the Learning Library. EQH/EQL are frequently used in combination with concepts such as Order Blocks and FVG (Fair Value Gap), and tend to provide a stronger basis for a trade than when used in isolation.
Real-World Examples and Identification Criteria
Take the EUR/USD 4-hour chart as an example. Suppose the following two swing highs formed over a two-week period.
| Date | Swing High (Close-Based) | Difference from Previous (pips) |
|---|---|---|
| July 1 | 1.10002 | − |
| July 8 | 1.09998 | 0.4 |
The difference between the two highs is 0.4 pips, which qualifies as an EQH under SMC criteria. The widely used rule of thumb is “within 5 pips and two or more occurrences on the same timeframe,” but there is no official definition, and different analysts apply thresholds ranging from 2 to 10 pips. It is important to establish your own numerical rules in advance, referencing the average spread and ATR of the timeframe and currency pair you use.
Stop-loss orders for long positions are concentrated just above 1.10000 (roughly +5 to +20 pips). If the market temporarily breaks above this level and “sweeps” the EQH, those stop-losses (sell orders) will be triggered all at once, potentially serving as counterpart supply for institutional short-position building. Once price falls back below 1.10000, the sweep is considered complete, and the candle that begins the reversal — or the zone immediately after it — is commonly used as an entry signal.
EQL is the perfect mirror image of the above. Stop-loss buy orders clustered just below the lows form the liquidity pool, and cases where the market temporarily breaks below the EQL before reversing are incorporated into short strategies.
Common Pitfalls for Beginners
- Assuming every EQH/EQL will sweep and reverse. Even when an EQH exists, a “true breakout” where the trend continues after price clears the level happens frequently. To distinguish a sweep from a breakout, you need to wait for a “fakeout confirmation” — a clear close back below the level after price has exceeded the EQH. Entering immediately without that confirmation risks missing the breakout and being caught in a countertrend position. SMC research itself notes that the reversal rate after an EQH break varies significantly by currency pair and session, and relying on a simple pattern match alone leads to overconfidence.
- Calling something an EQH without quantifying the pip threshold. Leaving the criterion of “roughly the same price zone” undefined leads to misidentifying independent swing highs as EQH, and then building strategies around liquidity pools that do not actually exist. We recommend setting rules in advance: 3–5 pips for EUR/USD on the 4-hour chart, 0.3–0.5 yen for USD/JPY, adjusted to account for your broker’s spread.
- Entering immediately right after a sweep. The moment price breaks above an EQH, spreads often widen and slippage becomes more likely. In practice, many traders wait after confirming sweep completion for a zone where a separate confluence — an Order Block, FVG, etc. — overlaps, and enter only after price has “come back” to that zone. Rushing into an early entry significantly worsens the risk-reward ratio.
- Ignoring higher-timeframe context (bias). Even if you enter short based on an EQL on a lower timeframe, if the daily or weekly chart is in a strong uptrend, the sweep may simply act as “energy refueling for the uptrend to resume after a pullback ends,” making the short strategy likely to end in a loss. When using EQH/EQL, always check the higher-timeframe trend direction and PD array placement, and build strategies only in the direction that aligns with that context.
FX AI Lab’s Perspective
At our lab, we are currently developing and testing EAs that incorporate liquidity-zone identification logic including EQH/EQL. All backtests include a mandatory OOS (out-of-sample) period, with prevention of overfitting (curve fitting) as a top priority. For guidance on how to read the metrics used to evaluate EAs, refer to our article on Profit Factor Benchmarks. We have no confirmed live-track-record products at this time, but we will publish verification data progressively on this blog as it accumulates. We are also exploring a phased rollout of copy trading on HFM demo accounts — please contact us for details.
Related Links
This article is for informational purposes only and does not constitute a solicitation or recommendation to invest in any specific financial product. FX trading carries price fluctuation risk and may result in losses exceeding your initial investment. All trading decisions are made at your own risk. Please review our Risk Disclosure for full details.