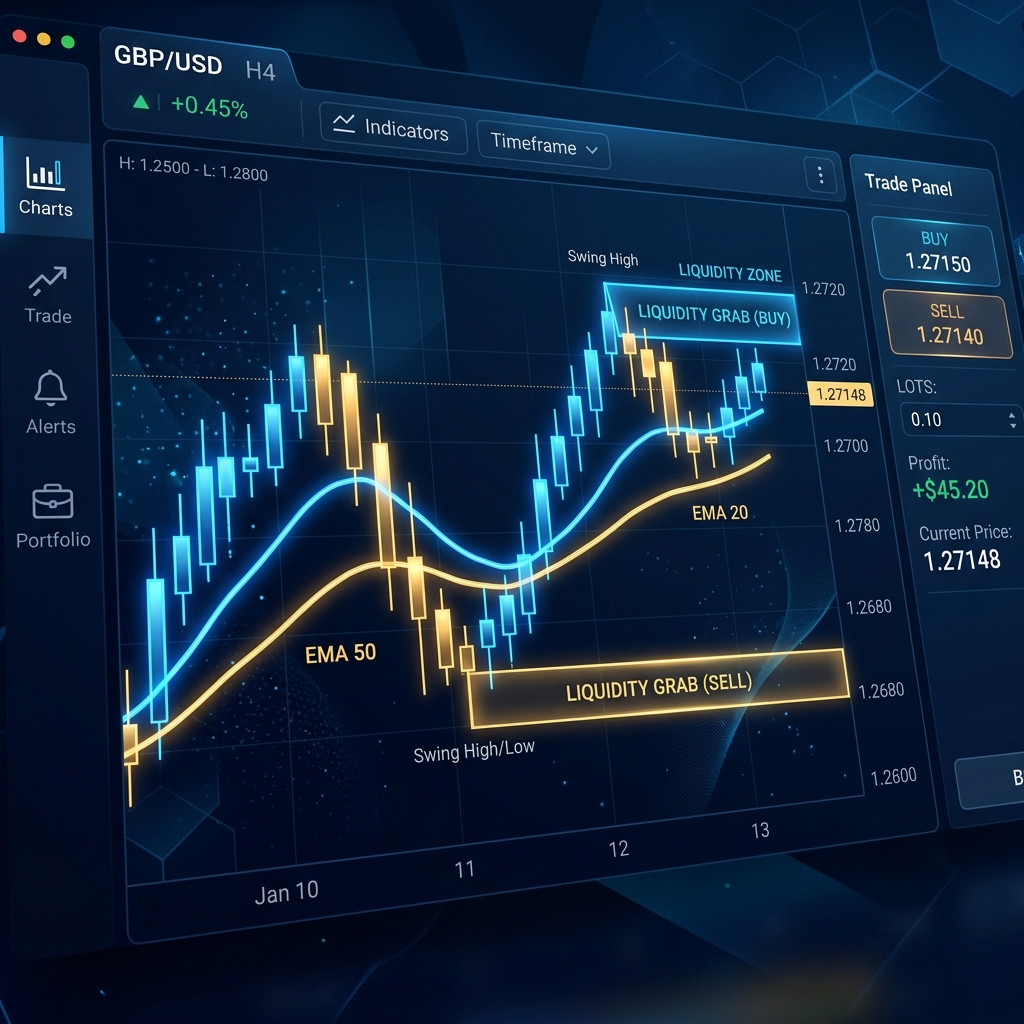
The Breaker Block is one of the most closely watched concepts in SMC (Smart Money Concepts) for identifying the origin points of market reversals. Yet it is often applied without a clear understanding of how it differs from an Order Block, and it is not uncommon to see traders fitting the zone onto a chart after the move has already played out. This article organizes “how to find SMC Breaker Blocks” — from definition and mechanics to formation steps, a USD/JPY example, and common beginner pitfalls — through the lens of our lab’s verification process.
Definition / How It Works
A Breaker Block is, in short, a “failed Order Block.” In SMC, the zone formed by the last opposing candle that preceded a strong impulsive move is called an Order Block. When price breaks through that Order Block and a structural shift (BOS or CHoCH) occurs simultaneously, the same zone flips to serve as support or resistance in the opposite direction. This is the Breaker Block, and its defining characteristic is that it is used in the context of reversals rather than trend continuation. For a summary of core SMC terminology, see the SMC Learning Page.
A bullish Breaker (a zone acting as support) forms when a bearish Order Block that was the origin of a decline gets broken to the upside. Sell-side liquidity resting below a recent low is swept (stop hunted), price then reverses and breaks above the prior swing high — and with this upward structural shift, the broken zone becomes a bullish Breaker. A bearish Breaker (resistance) is the mirror image: buy-side liquidity is swept, the market shifts structurally to the downside, and a bullish Order Block that was the origin of a rally gets broken to the downside.
In essence, a Breaker Block is the result of three converging events: (1) a liquidity sweep, (2) a structural shift in the market, and (3) the failure of an Order Block. Any zone that does not satisfy all three conditions cannot be called a Breaker Block, regardless of how similar it may look. For term definitions, please also refer to our FX Glossary Library.
Practical Example / Calculation / Charts
Using the USD/JPY 15-minute chart as an example, the steps for identifying a bearish Breaker (resistance) are outlined below. Note that the figures used are illustrative examples intended to convey the formation concept.
- Price rallies from 150.00 to 150.50 (High A), pulls back to 150.20, then reaches 150.65 (High B), sweeping the buy-side liquidity above High A.
- Price stalls at High B and then breaks below the recent swing low of 150.20, confirming a downside structural shift (BOS).
- The zone of the last bearish candle that pushed price up just before High B (e.g., 150.55-150.62) is the “failed bullish Order Block” — in other words, the bearish Breaker.
- When price returns to 150.55-150.62, rather than entering immediately, look for a reaction such as an upper wick or reversal candle, and place the stop loss just above High B (150.65) — this is one example of how the trade can be structured.
Order Blocks and Breaker Blocks are often confused, but their roles are clearly distinct. The table below summarizes the differences.
| Item | Order Block | Breaker Block |
|---|---|---|
| Basic Nature | Trend-continuation oriented | Reversal-oriented (failed OB) |
| Formation Condition | Last opposing candle at the origin of a strong impulsive move | OB is broken via liquidity sweep + structural shift |
| Liquidity | Not a required condition | Typically accompanied by a sweep (stop hunt) |
| Primary Use | Origin of pullbacks and retracements | Observe reaction on a return to the zone after a reversal |
Common Pitfalls for Beginners
While the Breaker Block concept may appear straightforward, omitting the prerequisite checks drastically reduces its reproducibility. The following are the typical failures our lab has repeatedly observed during verification.
- Confusion with Order Blocks: Calling a zone a Breaker when it has not yet been broken. Being “broken” in conjunction with a structural shift is a mandatory requirement.
- Insufficient structural shift confirmation: Entering a zone that merely looks good without verifying a BOS or CHoCH will often result in catching only a temporary retracement.
- Ignoring higher timeframe context: Relying solely on the 5-minute chart and trading zones that counter the higher timeframe trend leads to inconsistent accuracy. Always confirm alignment across multiple timeframes.
- Confusing a sweep with a breakout: Failing to distinguish a temporary wick-through (liquidity grab) from a genuine structural shift will undermine the accuracy of Breaker identification.
- Hindsight bias: Fitting a clean zone onto the chart after the move has already concluded provides no real-time edge. Verifying the conditions as they form is essential.
- Over-concentrating on a single zone and averaging down: Concentrating capital without accepting the possibility of being wrong, or averaging into a losing position to recover drawdown, can cause equity to deteriorate rapidly (see: Why Averaging-Down EAs Have Deep Drawdowns).
Evaluating a strategy’s edge should not be based on subjective feel — measuring it against objective metrics such as the Profit Factor benchmark is indispensable.
FX AI Lab’s Perspective
Because the Breaker Block is grounded in observable criteria — liquidity and structural shifts — it is well-suited for systematic rule-building and verification. Our lab is currently developing and testing implementations of this type of SMC judgment logic within EAs and copy-trading strategies. While we are not yet at the stage of presenting confirmed live trading results, we believe there is significant value in replacing the ambiguity that discretionary traders face — particularly around “confirming structural shifts” and “identifying sweeps” — with mechanical rules. For the latest verification updates and account opening instructions, please see the related links below.
Related Links
This article is intended for educational and informational purposes only and does not guarantee the profitability of any specific trading method or financial instrument. FX (foreign exchange margin trading) involves leverage, which means losses can exceed the margin deposited. Before trading, please read each broker’s risk disclosure documents carefully and trade based solely on your own judgment and responsibility.