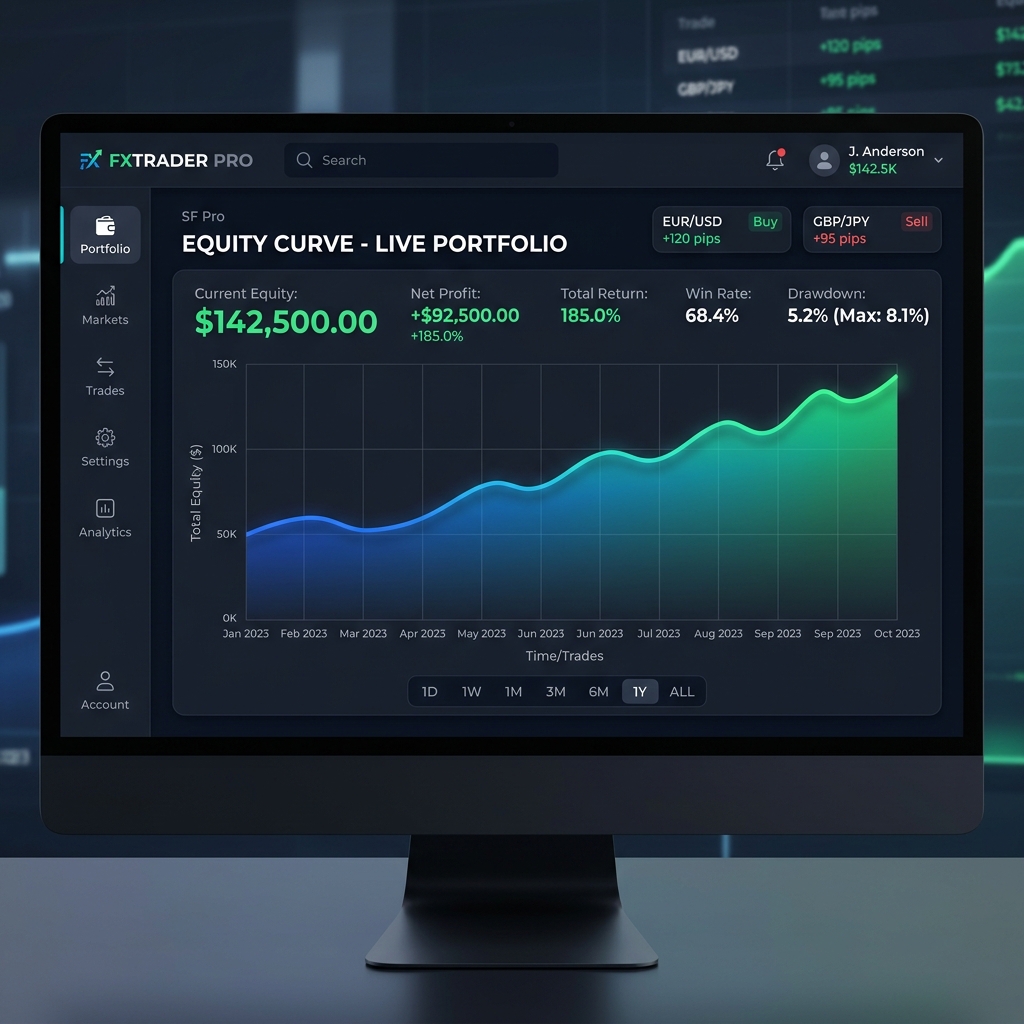
When you try to apply machine learning to FX trading predictions, questions arise one after another: “Which model should I use?”, “What input data should I use?”, and “Will it actually work in a live environment?” This article systematically explains the concrete steps for predicting FX markets with machine learning — from data collection and feature engineering to model selection and walk-forward validation — from a research lab perspective.
Definition and Mechanism of FX Prediction with Machine Learning
FX prediction with machine learning is a method that trains a model on historical price data and economic indicators to statistically estimate the direction and probability of future price movements. Whereas conventional rule-based EAs operate on fixed conditions such as “buy when price crosses above a moving average,” machine learning models automatically extract patterns from the data. Because prediction accuracy fluctuates with changes in market conditions, continuous retraining and evaluation of the model are assumed to be necessary.
A typical pipeline consists of the following four stages.
- Data Collection: In addition to OHLCV (Open, High, Low, Close, Volume), technical indicators such as RSI, ATR, and Bollinger Band width are collected. In some cases, the Dollar Index (DXY) and VIX are also utilized as external variables.
- Feature Engineering: Because raw price series are non-stationary time series, they are transformed into log returns (log(P_t / P_{t-1})) or moving-average deviation ratios ((P_t – MA_n) / MA_n) to achieve stationarity.
- Model Training: The three most commonly used families are Random Forest, Gradient Boosting (XGBoost / LightGBM), and LSTM (Long Short-Term Memory). Because each excels at different types of problems, comparing multiple models is recommended.
- Evaluation and Deployment: Out-of-sample accuracy is measured using walk-forward validation, and the Sharpe ratio and drawdown are also checked. Even after a backtest shows promising results, regular re-evaluation in the live environment is essential.
Concrete Features and Accuracy Benchmarks
As a practical workflow example, we use binary classification of up/down moves on the EURUSD 1-hour chart.
| Variable Name | Formula | Purpose / Notes |
|---|---|---|
| log_return_1h | log(Close_t / Close_{t-1}) | 1-period log return (stationarized) |
| rsi_14 | RSI(14) | Overbought / oversold strength |
| bb_width_20 | (Upper – Lower) / Mid | Volatility-width indicator |
| atr_14 | ATR(14) | Absolute volatility (convertible to pips) |
| macd_diff | MACD – Signal | Momentum (sign direction matters) |
| hour_sin / hour_cos | sin/cos(2π × hour / 24) | Cyclical encoding of time-of-day |
When the above features are used with a Random Forest, a realistic out-of-sample accuracy benchmark is approximately 56-59%. Whether a positive expected value can be confirmed in a backtest after deducting spread and slippage (assumed to total 0.5-0.8 pips for EURUSD) is the starting point for development. If a result exceeding 70% accuracy appears, strongly suspect data leakage or overfitting.
Below is a Python implementation example using scikit-learn. For time-series data, it is essential to use TimeSeriesSplit, which preserves temporal order, rather than the standard KFold.
from sklearn.ensemble import RandomForestClassifier
from sklearn.model_selection import TimeSeriesSplit

clf = RandomForestClassifier(n_estimators=300, max_depth=6, random_state=42)
tscv = TimeSeriesSplit(n_splits=5)
Using standard KFold causes “data leakage,” where future data is mixed into training. Always use TimeSeriesSplit or a walk-forward split for time-series data.
Common Pitfalls for Beginners
- Data Leakage (most critical): If a model is trained with future information mixed into its features, the backtest will show abnormally high accuracy, but the model will not function in a live environment. The first step is to clearly define when each indicator is calculated (specifically, whether it is after the candle’s Close is confirmed) and how the target variable is defined (whether the prediction target is the t+1 close price or the open price).
- Overfitting: A model that overfits the training data will show a significant drop in accuracy on unseen data. If the difference in accuracy between training and test data is 5% or more, overfitting is highly suspected. Suppress it with
max_depthlimits (around 6-8), increasedmin_samples_leaf, L2 regularization, and similar techniques. - Using Non-Stationary Data As-Is: Using raw closing prices as features changes their meaning over time (absolute price levels differ greatly between 2020 and 2024). The basic approach is to stationarize by converting to differences or relative values such as log returns or deviation ratios.
- Not Accounting for Transaction Costs: Backtests that ignore spread and slippage overstate profits. Check the profit factor and other performance metric benchmarks separately, and evaluate using cost-inclusive Sharpe ratio.
- Single-Period Backtests Only: There are many cases where a model optimized for the trending market of 2020-2021 fails in the high-volatility, range-bound market of 2022-2023. Conduct walk-forward validation covering multiple market environments.
FX AI Research Lab Commentary
Our lab continues to research FX prediction utilizing machine learning. We are currently in the demo-environment verification stage, testing whether settings that produced promising backtest results perform similarly in actual markets. We aim to improve the accuracy of a system in which AI autonomously makes trading decisions and to publish that process with transparency. We are also developing a copy-trade system using an HFM demo account; those considering participation are invited to visit the HFM account opening page. For research progress and details, please contact us via the inquiry form.
Related Links
This article is for informational purposes only and does not recommend buying or selling any specific investment product or trading method. FX trading involves the risk of principal loss due to leverage. Investment decisions are made at your own responsibility. Please see our Risk Disclosure for details.