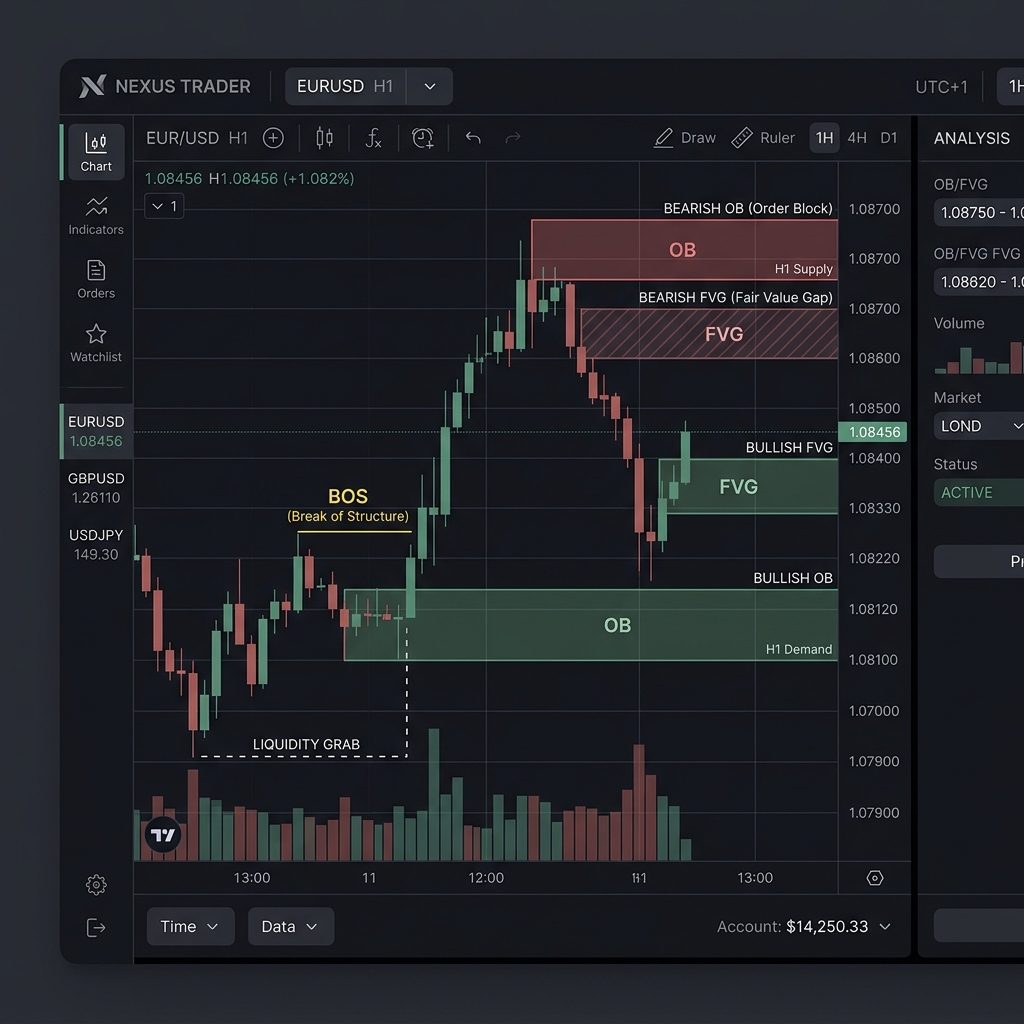
Many traders keep taking stop-loss hits because they assume gold moves at any time of day. XAU/USD price action is far from uniform: volatility can differ by several multiples depending on the session. This article organizes the typical price ranges for the Tokyo, London, and New York sessions using Japan Standard Time as the reference point, and explains how session selection affects trading costs and risk.
What Is Volatility? A Definition in the Context of Gold Trading
Volatility is a measure of how large and how quickly an asset’s price moves. In FX and precious-metals trading, ATR (Average True Range) and standard deviation are the most commonly used tools.
True Range is defined as the largest of the following three values.
- High minus low for the period
- |High minus previous close|
- |Low minus previous close|
ATR(n) is the n-period moving average of True Range. For XAU/USD, the one-hour (H1) ATR is the most frequently referenced in practice. Because it is denominated in US dollars, an ATR of 10 means “the average hourly range is approximately $10.”
The fundamental reason gold’s price behavior varies so much by session is the business hours of the world’s major trading centers. The bulk of global physical gold trading is concentrated in London and New York, while the Tokyo market plays a comparatively smaller role in providing liquidity. Thin liquidity periods have fewer participants, so price tends not to move much under normal conditions, but a single large order can trigger a sharp spike.
The London Fix, set twice daily by the London Bullion Market Association (LBMA), serves as the settlement benchmark for institutional investors, and large orders tend to cluster around those fixings. Converted to Japan Standard Time (JST = UTC+9), during British Summer Time (last Sunday in March through last Sunday in October) the AM Fix falls around 18:30 JST and the PM Fix around 23:00 JST; during winter time each shifts roughly one hour later.
Price Ranges by Session: JST Reference Values and How to Read Them
The table below shows session-by-session tendencies derived from H1 ATR median values for 2020-2024. These figures fluctuate by year, month, and market conditions, so treat them as reference values only.
| Session | Japan Time (Summer) | Japan Time (Winter) | H1 ATR Guide (USD) | Key Characteristics |
|---|---|---|---|---|
| Tokyo (Asia) | 06:00-15:00 | 07:00-16:00 | 3-8 | Thin volume; spread widening is common |
| London | 16:00-01:00 next day | 17:00-02:00 next day | 8-18 | European capital inflows; volume concentrates around the Fix |
| New York | 21:00-06:00 next day | 22:00-07:00 next day | 10-22 | US economic data releases; highest overall volume |
| London + NY Overlap | 21:00-01:00 next day | 22:00-02:00 next day | 15-30+ | Peak volatility window; sharp moves in both directions |
The ATR difference between the Tokyo session and the London+NY overlap can reach as much as 4 to 5 times. Even trading the same 0.1-lot size, the expected range, potential stop-loss amount, and slippage risk are entirely different. If position size is not adjusted per session, effective risk exposure can vary by several multiples depending on the time of day.
During major data releases such as US Non-Farm Payrolls (first Friday of each month), FOMC statements, and CPI announcements, price spikes can occur at the start of New York trading hours. In Japan time, the most common release window is 21:30 JST in summer and 22:30 JST in winter. H1 ATR during these events can reach two to three times or more above normal, making it essential to cross-reference an economic calendar.
Common Pitfalls for Beginners
- Mistaking the “quiet” Tokyo session for safety: Thin liquidity means lower volatility on average, but it also means a single large order can send prices sharply in one direction. Some brokers widen spreads to two or three times their normal level during this session, so a tight stop-loss can be triggered unintentionally.
- Ignoring summer/winter time changes: Europe and Japan switch daylight saving time on different schedules. Memorizing a fixed rule like “NY opens at 21:00 every day” will put you off-time during the transition weeks in March, October, and November. Make it a habit to check each country’s changeover date as it approaches.
- Leaving spread widening out of your loss calculation during data releases: XAU/USD typically carries a spread of around $2-5, but some brokers widen it beyond $20 immediately before major releases. This raises the risk that stop-loss orders are not filled at the intended price, making actual losses larger than planned.
- Evaluating a strategy using data from only one session: Backtests restricted to the London and NY open tend to look favorable. Including the Tokyo session across the full period can significantly change the results. Even when applying a session filter, always compare results against unfiltered full-period performance to check for overfitting.
- Equating high volatility with high profit opportunity: Wider ranges do mean more pip-level opportunity, but loss risk expands equally. If you do not adjust lot size, your risk is amplifying without you noticing. Position size should be scaled to match ATR.
FX AI Lab Commentary
Our lab continuously tests session-specific volatility characteristics on XAU/USD. EAs currently under development and evaluation include a session filter that suppresses new entries during the Tokyo session. That said, tendencies derived from historical data do not guarantee future price behavior. For our EA evaluation criteria, see Validation Metrics for Evaluating Gold EAs; for overall strategy profit-and-loss assessment, refer also to Profit Factor Benchmarks and How to Read Them. We strongly recommend an adequate demo-account testing period before applying any strategy to a live account.
Related Links
This article is provided for informational purposes only and does not constitute a solicitation to invest in any specific financial product. Trading financial instruments involves the risk of loss of principal. All investment decisions are made at your own responsibility. Please review the Risk Disclosure for full details.