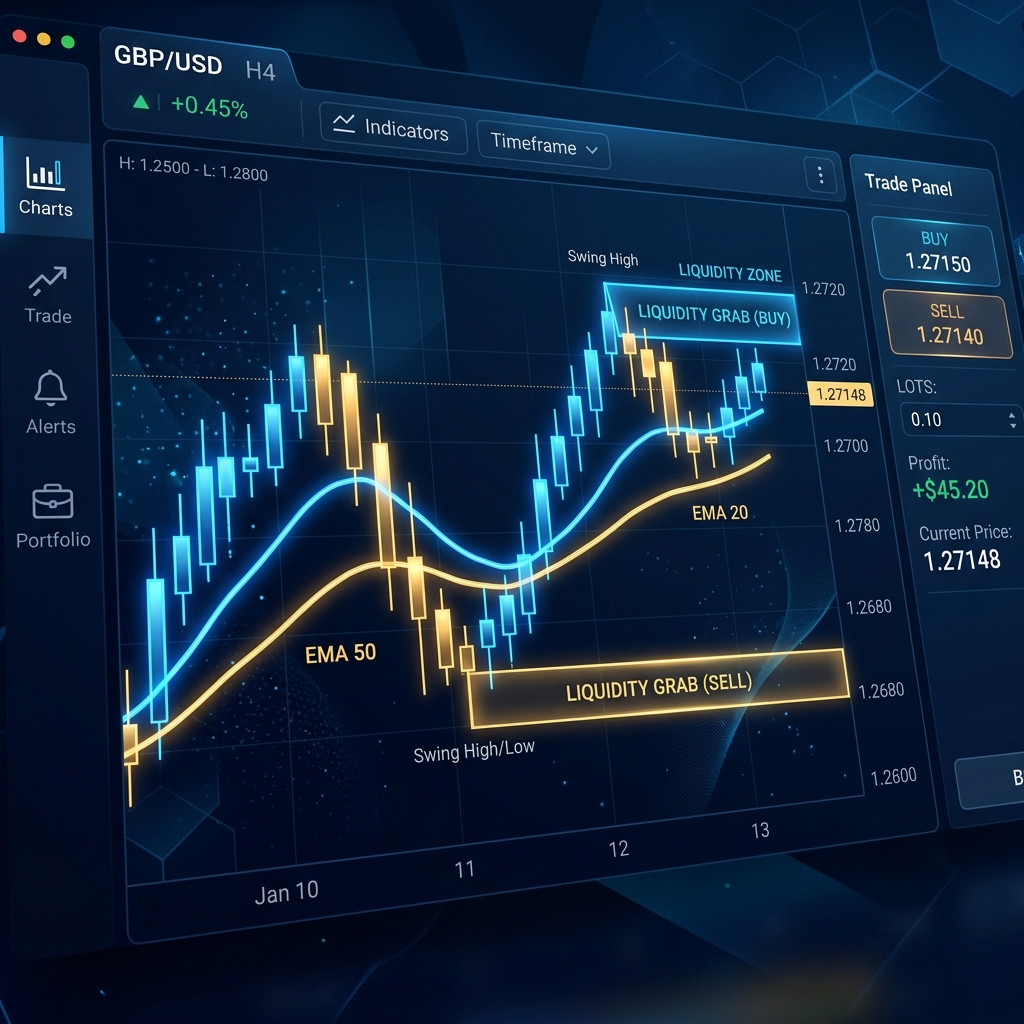
References to “AI predicting the forex market” are becoming increasingly common. Yet quantitative information on how accurately machine learning models can actually forecast exchange rates — and where their limits lie — remains scarce. This article covers everything from how predictive accuracy is defined, to measured values from representative models, to the structural limitations that are easy to overlook.
How AI FX Prediction Works: Definitions and Key Mechanisms
AI-based FX prediction is the process of training a model on historical data — prices, volume, economic indicators, and more — to estimate the future direction or magnitude of price movements. Three main architectures are in practical use today.
LSTM (Long Short-Term Memory Network)
A type of recurrent neural network that learns long-range dependencies in time-series data. It is well suited to capturing patterns in which “movements from several hours ago” influence “current movements,” as is common in forex data.
Transformer
A model with an attention mechanism originally developed for natural language processing. It handles parallel computation better than LSTM and has been applied to multimodal forecasting that combines economic news text with price data.
Random Forest / Gradient Boosting
Ensemble methods that combine multiple decision trees. Feature importance is relatively easy to visualize, and these approaches are frequently used alongside technical indicators.
Model output falls into two broad categories: “price-level prediction (regression)” and “direction prediction — up or down (classification).” In practice, the latter — predicting whether the next candle closes higher or lower — is the central evaluation metric, known as Directional Accuracy (DA).
Accuracy Metrics and Empirical Values from Academic Research
The formula for Directional Accuracy (DA) is straightforward.
DA(%) = (Number of periods with correct direction prediction / Total number of predicted periods) x 100
A pure random walk (coin flip) yields an expected DA of 50%. Once spread and swap costs are accounted for, the practical lower bound needed for a positive expected value is generally considered to be around 52-54%.
Compiling empirical values from academic literature, the following ranges have been reported (these are validation figures for specific markets and time periods and do not constitute a universal performance guarantee).
| Model | Currency Pair | Directional Accuracy (DA) | Notes |
|---|---|---|---|
| LSTM | EUR/USD 1-Hour | 54-57% | Reports above 60% exist when overfitting is not adjusted for |
| Transformer | USD/JPY Daily | 53-58% | Combined with news sentiment scores |
| Random Forest | GBP/USD 1-Hour | 52-56% | 20 technical indicators used as features |
The margins look small, but if a DA above 52% holds consistently even after spread deductions, the long-term expected value turns positive. The difficulty lies in the word “consistently.”
Directional accuracy alone is also insufficient. To assess the quality of returns, you need to check Profit Factor (PF) and Sharpe Ratio as well. How to interpret these metrics is covered in Profit Factor Benchmarks and How to Read Them.
Common Pitfalls for Beginners
Here are five key pitfalls to watch for when evaluating AI-based FX predictions.
- Backtest Overfitting (Curve Fitting)
This occurs when a model becomes over-optimized to historical data. It is not uncommon for backtest accuracy to exceed 70% while dropping to the low 50s on unseen (out-of-sample) data. Make sure training and validation periods are clearly separated and that walk-forward testing has been performed. - Data Leakage (Future Information Contamination)
Errors in feature engineering can allow information that technically belongs to the “future” to leak into training data. For example, using a moving average based on closing prices as a feature at the start of the same day is, strictly speaking, referencing future information. Any model with suspiciously high accuracy should first be examined for this kind of leakage. - Vulnerability to Market Regime Changes
Events such as the COVID-19 shock in 2020 or the invasion of Ukraine in 2022 cause sudden structural shifts in market correlations. When this happens, predictive accuracy for models trained on prior data drops sharply. AI can “learn from what has happened” but is fundamentally ill-equipped to “anticipate what has not happened yet.” - Confusing Directional Accuracy with Returns
A “55% accuracy” figure does not automatically translate into a “5% edge.” Asymmetries between stop-losses and take-profits, spread costs, and slippage all accumulate — meaning a DA of 55% can still result in a net loss. For more on drawdown depth and recovery periods, see Why Drawdowns Run Deep. - Overconfidence in Short-Sample Periods
A strong three-month backtest may simply mean that period happened to match the model’s strengths. Ideally, validation should span at least three to five years and cover trending markets, ranging markets, and high-volatility environments. For concrete examples of evaluation metrics applied to gold EAs, see Evaluation Metrics for Gold EA Verification.
FX AI Lab’s Perspective
At this lab, we do not present AI model predictive accuracy as a “guarantee of wins or losses.” Markets are nonlinear systems that emerge from the collective behavior of all participants, and no model achieves zero error. In the AI discretionary EA currently under evaluation, we prioritize “entry timing design” and “risk-reward ratio optimization” over directional accuracy. We have set benchmark criteria of a Profit Factor of 1.3 or higher and a maximum drawdown within 15%, and verification is ongoing. The latest verification data is published on a rolling basis in the Research Library. If you would like to experience our verified strategy through copy trading, start with opening an HFM demo account.
Related Links
This article is provided for informational purposes only and does not constitute a solicitation to invest in any specific financial product or trading method. FX trading carries foreign exchange risk and may result in losses exceeding the initial investment. Please review our Risk Disclosure for details.